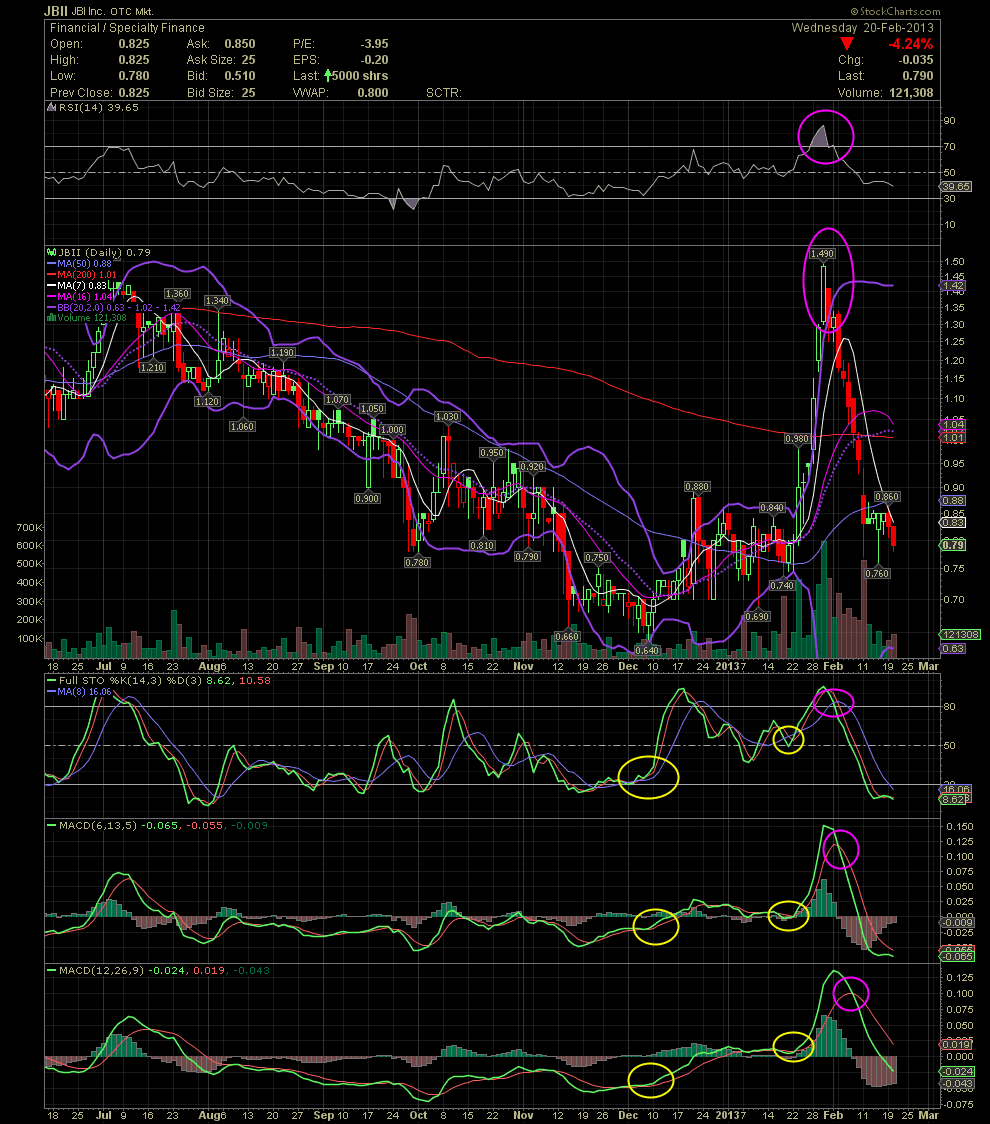
JBII Daily Chart........... A quick view at the de
Post# of 2561

JBII Daily Chart........... A quick view at the development of a nice swing trade
JBII has been a great stock to swing trade over the last 3-4 years. Here was a trade that a few of us did from late Jan into early Feb. I've circled in yellow the FullSto and MACD set ups that I look for. The opposite set up is what I've circled in pink. Obviously there are more than just these two indicators that I look for at during the same set up. One of those would be the crossovers of the MA7 and 16. Note the positioning of that item when JBII began to run and also when it sold off. It's a bit slower than the FullSto and MACDs. As some technical traders wait for the crossovers of the various Moving Averages, such as the 7/16 or 10/20, I find that they are lagging the faster indicators. But here's a very nice example of why charts are a great compliment to ones DD. You can buy and hold forever, or use the technicals to vastly improve your overall returns. With JBII at the moment, I'm waiting for another set up to buy the stock. Although the stock is back to the high .70s/low .80s of our last swing trade, I'm waiting for the indicators to reset. Imo, JBII isn't ready yet. Of course, any strong material news would trump the technicals. But for now, I don't see a bottom in place yet.

 (0)
(0) (0)
(0)