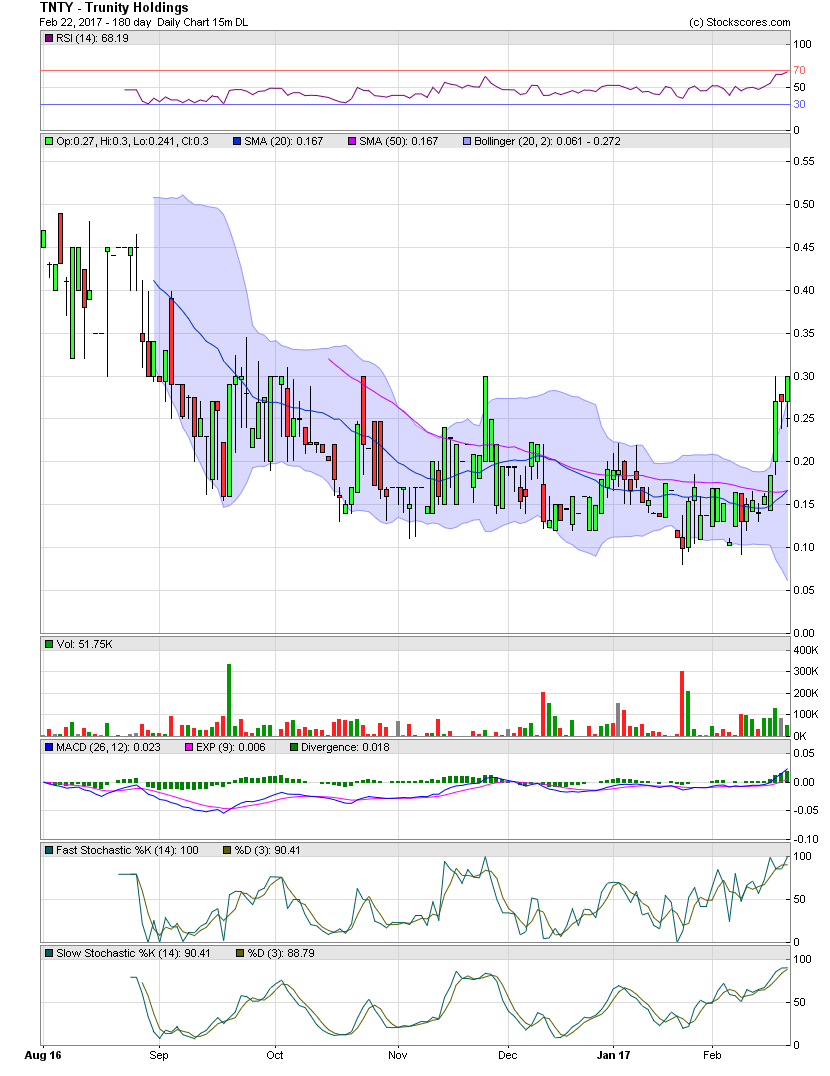
TNTY Daily Chart ~ Moving Higher As Expected So
Post# of 2561

So far, so good. Up from .0925 less than two weeks ago. Here's a quick look at the TNTY chart. Please review my previous post on TNTY for an explanation of what I was looking for:
http://investorshangout.com/post/view?id=4367832
Friday's close was .27, and the stock closed at .30 today, which is the level of the tops I mentioned in my post of Feb 20. I'm now looking for a break and close above .30 as early as tomorrow. Should we see this occur on strong volume, that will bring into play tests of much higher levels, with a short term target in the high .40s/.50, followed by a possible move to $1.00+. Any material events to accompany the technicals would be a very welcome development. GLTA

 (0)
(0) (0)
(0)