$TNTY Daily Chart ~ Weeks of Consolidation After M
Post# of 2561

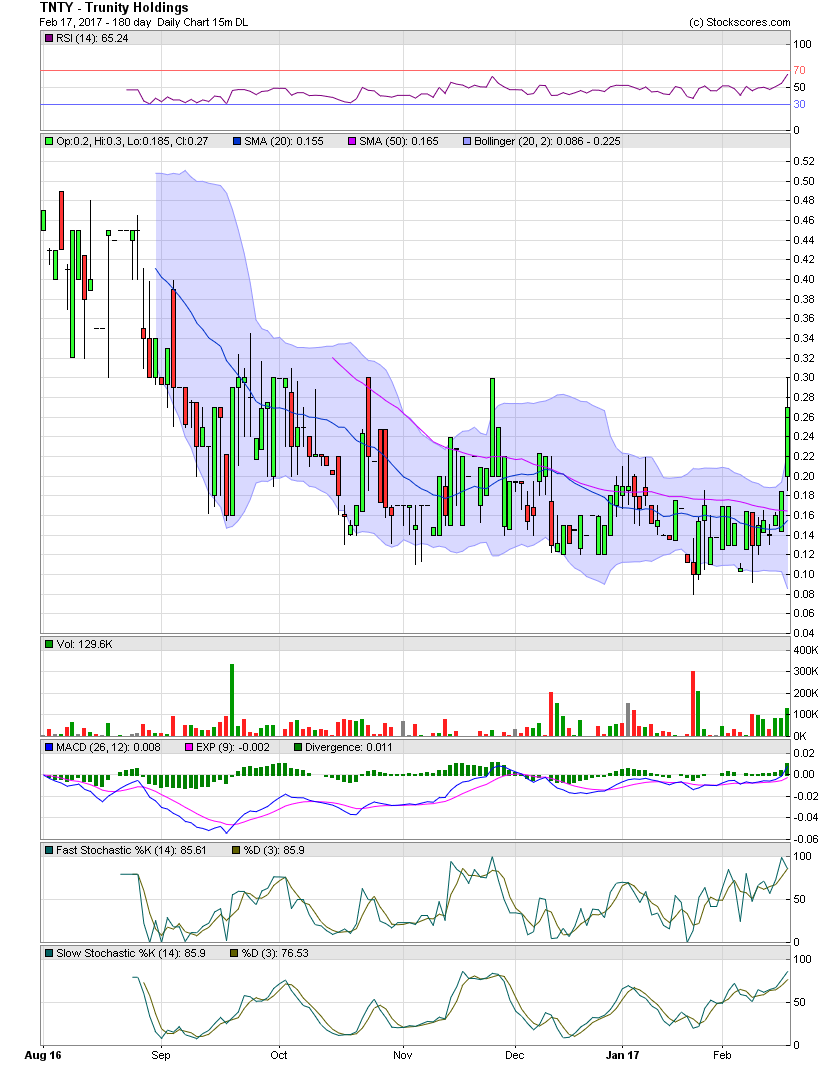
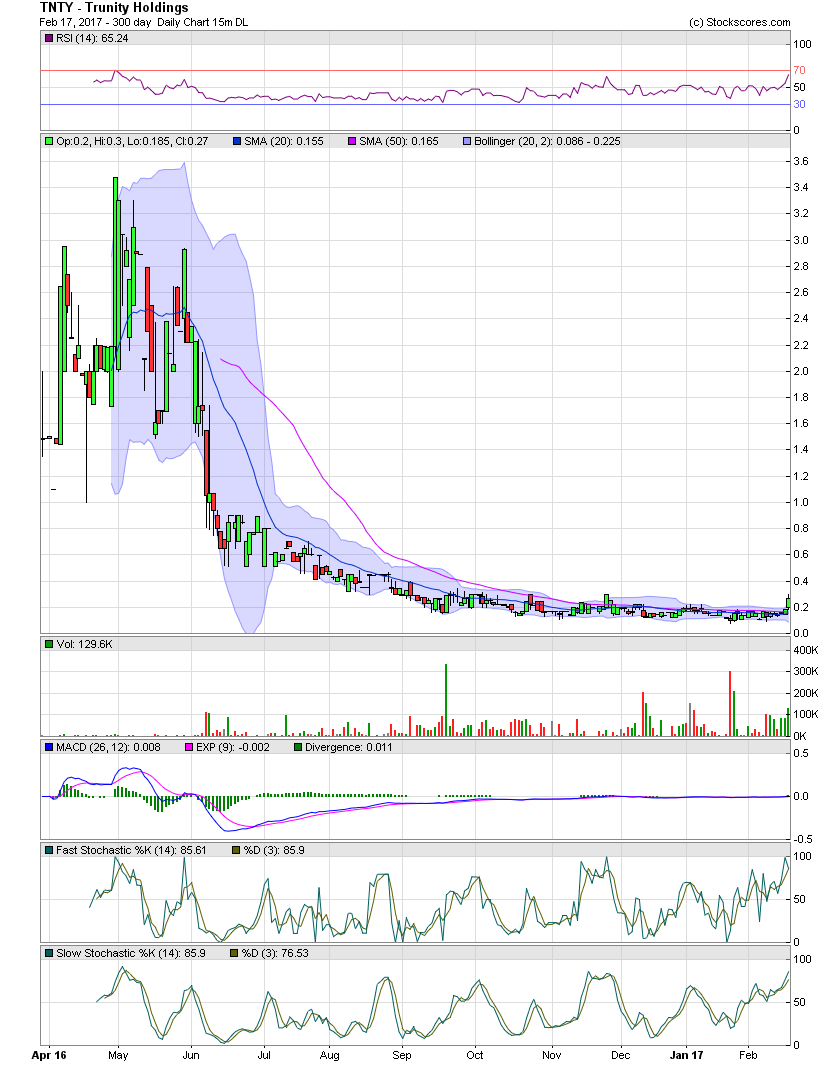
TNTY began to reverse its trend from a consolidation period after a multi-month decline from a high in the $3.40s. I'm sharing two charts below. The first is a 7 month chart and the second is 10 month chart. The first chart reflects the basing of the stock at .12 with a few dips to lower levels. Just over one week ago, the stock was trading intraday as low as .0925. Last week, the stock took a sharp move higher and closed the week at .27, while trading to as high as .30 on Friday. One can see the previous tops in place at .30 (with a few intraday moves higher) established in Sept, Oct and Nov. A close above .30, with good volume, would suggest a move to much higher levels and possibly testing the levels not seen since last June. The second chart simply shows the longer term decline from over $3.40 and the very long period of basing.
TNTY has a long way to go before reaching those prices. But my opinion remains that the stock can see that happen as new and solid management is now executing its business plan with LOI/acquisitions of compound pharmacies, all of which have been delayed for months. GLTA


 (0)
(0) (0)
(0)