MPIX Weekly Chart........ OH YEAH!!! I use the
Post# of 5570

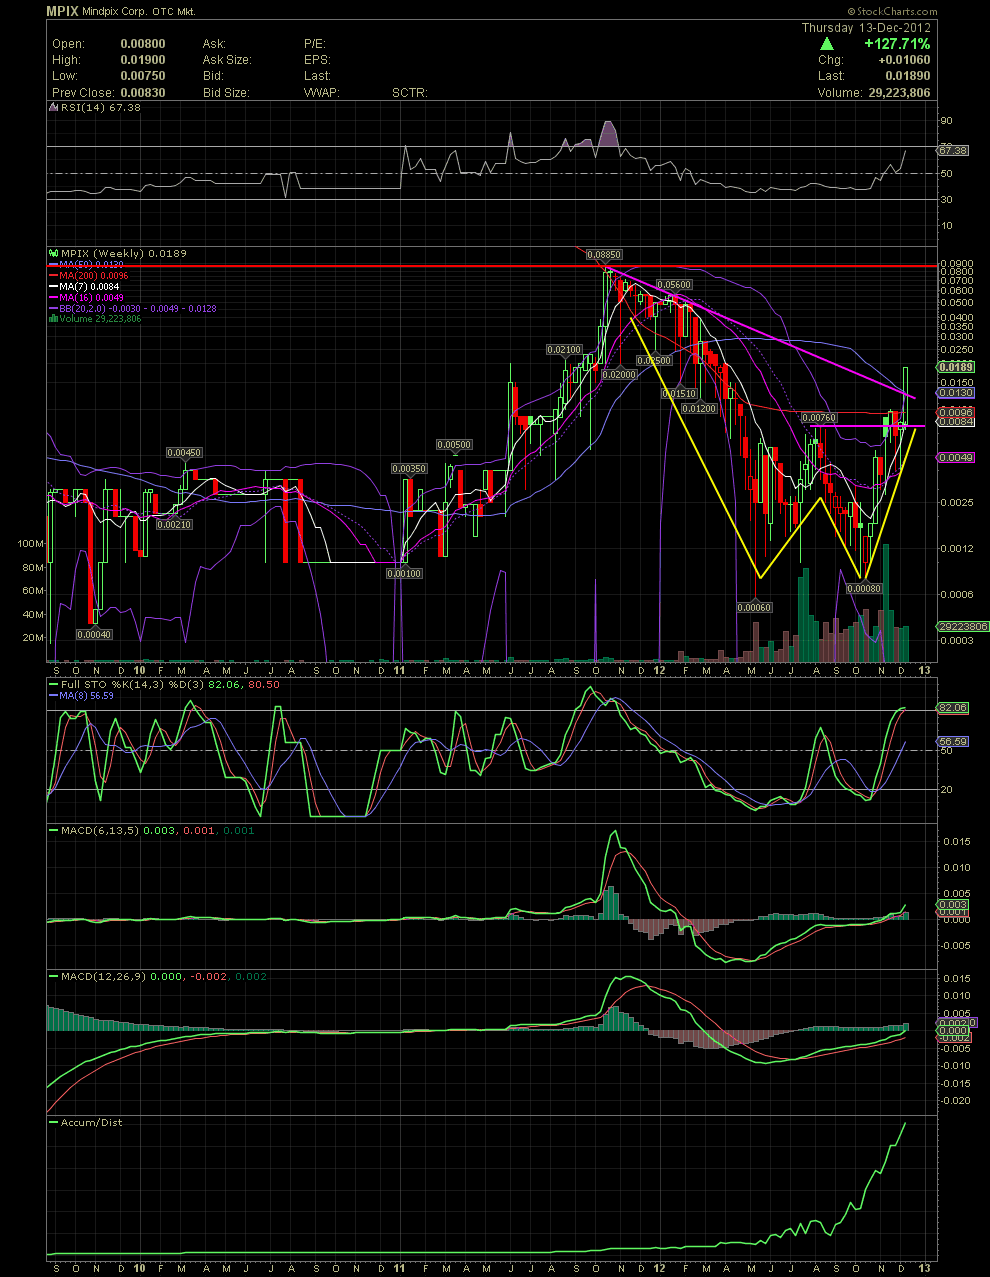
MPIX Weekly Chart........ OH YEAH!!!
I use the weekly chart simply to see what the weekly indicators are showing. The weekly numbers show that the stock isn't nearly as overbought as the daily chart. The RSI is just nearing the 70 line. The MACDs still show that there's a lot of room to the upside. Although at first glance, the FullSto appears to be overbought. But compare the current level of the FullSto to its position in Sept of last year. The stock was trading in the .02s but still ran to .0885 by late October before the chart showed a sell signal in November. So we are now trading near .02 today. Hmmmm. Could we see .0885 again during this move? Possibly. Keep in mind, the run of last year was done with no projects or contracts in place. what we find with MindPix today is at least one project, ZZYX Entertainment and the 12-21 concert, underway. We all know that management is working on a number of other projects also. I believe that MPIX is going to take out the old high of .0885 and move much higher in 2013. This chart and the previous two hold a wealth of information. Use it to your advantage. Technical analysis is a great tool to compliment your fundamental DD. GLTA

 (0)
(0) (0)
(0)