Investors Hangout Stock Message Boards Logo
  • Mailbox
  • Favorites
  • Boards
    • The Hangout
    • NASDAQ
    • NYSE
    • OTC Markets
    • All Boards
  • Whats Hot!
    • Recent Activity
    • Most Viewed Boards
    • Most Viewed Posts
    • Most Posted
    • Most Followed
    • Top Boards
    • Newest Boards
    • Newest Members
  • Blog
    • Recent Blog Posts
    • Recently Updated
    • News
    • Stocks
    • Crypto
    • Investing
    • Business
    • Markets
    • Economy
    • Real Estate
    • Personal Finance
  • Market Movers
  • Interactive Charts
  • Login - Join Now FREE!
  1. Home ›
  2. Stock Message Boards ›
  3. Stock Boards ›
  4. Mindpix Corporation (MPIX) Message Board

MPIX 18 Month Daily Chart........ A Longer Term Vi

Message Board Public Reply | Private Reply | Keep | Replies (0)                   Post New Msg
Edit Msg () | Previous | Next


Post# of 5570
Posted On: 12/14/2012 3:37:57 AM
Avatar
Posted By: Big Tuna

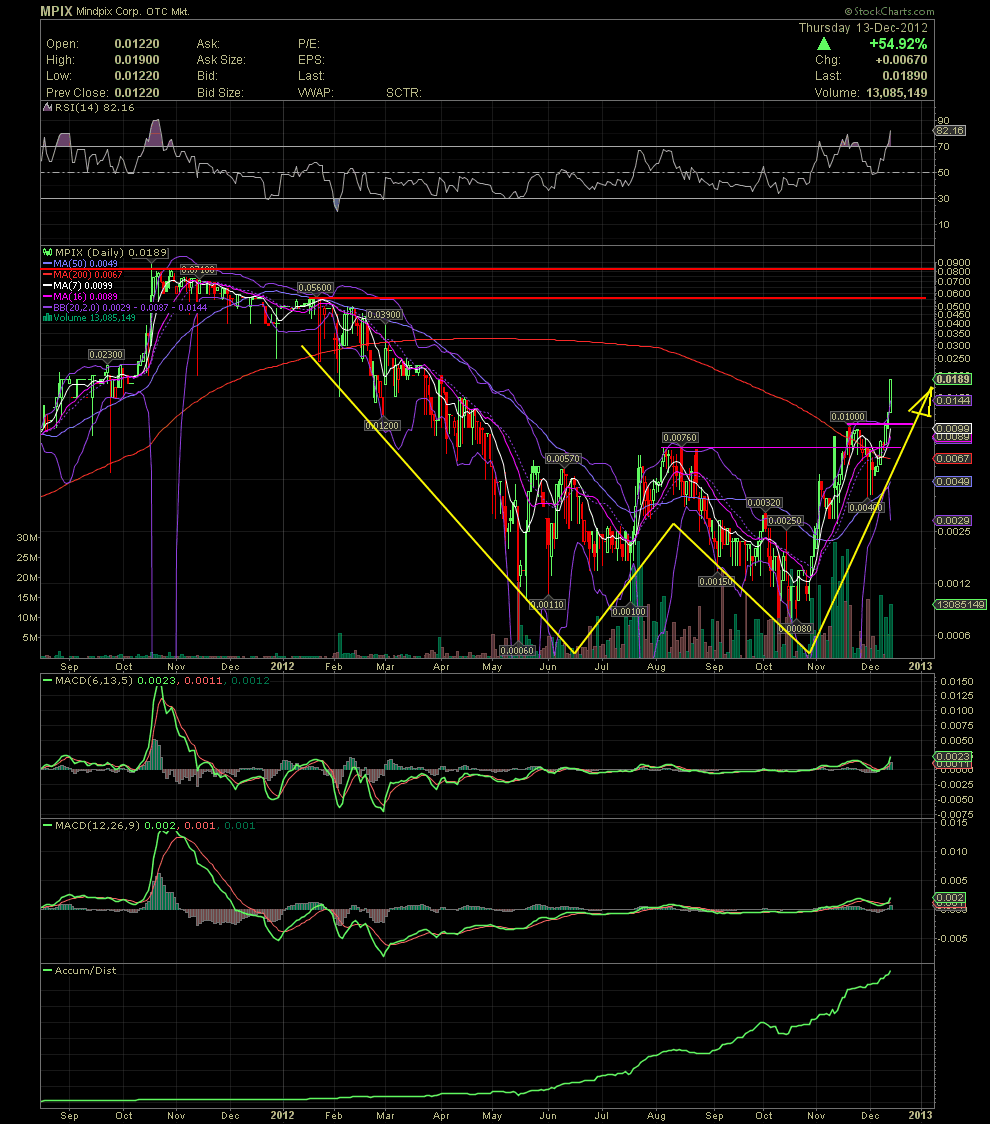
MPIX 18 Month Daily Chart........ A Longer Term View for Those With a Vision


Ok, at the risk of boring a few with continued discussion of the "W Formation", here we go. As I've mentioned since mid October when the stock was moving above .0012 after a low of .0008, the stock would need to eventually break above the center portion of the 'W' which was at .0076. The first attempt to breakout occurred after breaking thru the .0076 to a high of .001. The stock sold off but held the MA50 near .004. After a few days of consolidation, the stock began to move up again. The .001 now became the next level of resistance that the stock would have to surpass. That occurred on Tuesday's close and the morning of Wednesday. This breakout has now lead to an 89% gain since the .001 was taken out. Wow! Check out that A/D line at the bottom of the chart. There's been some serious accumulation going on since June through the entire correction of August into October. Finally, I see very little resistance now that we are clearly up and over that "W Formation". Next resistance should be the two, horizontal, red line at .056 and .0885. Oh, you'll like the next chart too! GLTA


MPIX 18 Month Daily Chart


(0)
(0)


Mindpix Corporation (MPIX) Stock Research Links


  1.  
  2.  


  3.  
  4.  
  5.  


Investors Hangout

Home

Mailbox

Message Boards

Favorites

Whats Hot

Blog

Settings

Privacy Policy

Terms and Conditions

Disclaimer

Contact Us

Whats Hot

Recent Activity

Most Viewed Boards

Most Viewed Posts

Most Posted Boards

Most Followed

Top Boards

Newest Boards

Newest Members

Investors Hangout Message Boards

Welcome To Investors Hangout

Stock Message Boards

American Stock Exchange (AMEX)

NASDAQ Stock Exchange (NASDAQ)

New York Stock Exchange (NYSE)

Penny Stocks - (OTC)

User Boards

The Hangout

Private

Global Markets

Australian Securities Exchange (ASX)

Euronext Amsterdam (AMS)

Euronext Brussels (BRU)

Euronext Lisbon (LIS)

Euronext Paris (PAR)

Foreign Exchange (FOREX)

Hong Kong Stock Exchange (HKEX)

London Stock Exchange (LSE)

Milan Stock Exchange (MLSE)

New Zealand Exchange (NZX)

Singapore Stock Exchange (SGX)

Toronto Stock Exchange (TSX)

Contact Investors Hangout

Email Us

Follow Investors Hangout

Twitter

YouTube

Facebook

Market Data powered by QuoteMedia. Copyright © 2025. Data delayed 15 minutes unless otherwise indicated (view delay times for all exchanges).
Analyst Ratings & Earnings by Zacks. RT=Real-Time, EOD=End of Day, PD=Previous Day. Terms of Use.

© 2025 Copyright Investors Hangout, LLC All Rights Reserved.

Privacy Policy |Do Not Sell My Information | Terms & Conditions | Disclaimer | Help | Contact Us