QUES Weekly Chart ~ Finally at a Support Leve P
Post# of 2561
Posted On: 06/11/2016 4:43:10 PM

QUES Weekly Chart ~ Finally at a Support Leve
Per a few requests, I was asked for thoughts on QUES. I really have no fundamental information, other than what has been released to date. I'm hearing good things are coming, but in all honesty, I've been hearing the same story for a very long time now. At one time, I held a decent position in QUES, which began with initial entries at .07/.08. I did average up over months. But as filings came out over a few quarters with poor earnings and increasing debt, I gradually sold from the .60s to as low as .22. I am currently not a shareholder.
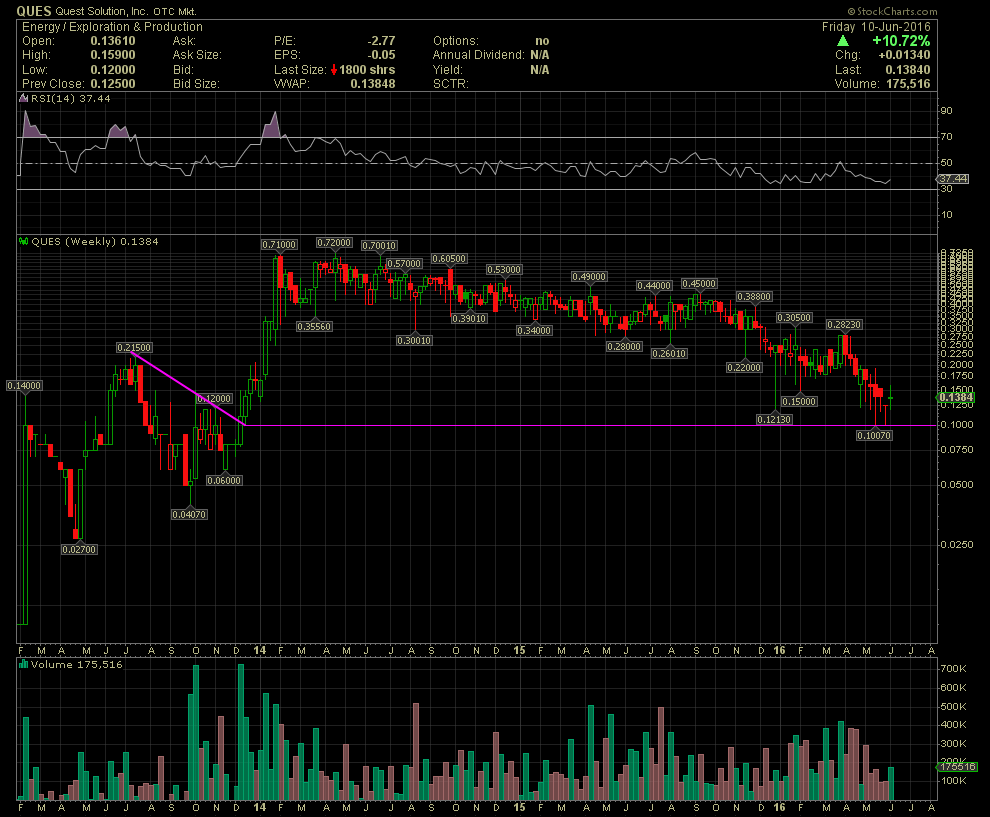
So all I can offer to those asking about QUES is some charting and technical observations. I was asked where I might see some support. The daily only shows that a base might be forming the is .107 to .12 level. The chart below is a Weekly Chart with a timeline of 3 years, and does show the reason for a potential bottom at the current area. If one were to go back to the July thru Dec, 2013 area, one can see a declining tops line which I annotated. Notice the point where the stock broke thru and beyond that resistance line. The reversal occurred at the .10-.12 level, which is no surprise to me that the stock is now attempting to base at, after almost 2.5 years of gradual and steady decline. I don't see much yet on the daily chart to give me much more inclination that a move is imminent. That said, should management finally release material events and filings that prove that the debt levels have been reduced, the margins have increased, and the share structure is intact, then the fundamentals will result in an increased share price. Until then, not much to rely on with the charts. GLTA
Per a few requests, I was asked for thoughts on QUES. I really have no fundamental information, other than what has been released to date. I'm hearing good things are coming, but in all honesty, I've been hearing the same story for a very long time now. At one time, I held a decent position in QUES, which began with initial entries at .07/.08. I did average up over months. But as filings came out over a few quarters with poor earnings and increasing debt, I gradually sold from the .60s to as low as .22. I am currently not a shareholder.
So all I can offer to those asking about QUES is some charting and technical observations. I was asked where I might see some support. The daily only shows that a base might be forming the is .107 to .12 level. The chart below is a Weekly Chart with a timeline of 3 years, and does show the reason for a potential bottom at the current area. If one were to go back to the July thru Dec, 2013 area, one can see a declining tops line which I annotated. Notice the point where the stock broke thru and beyond that resistance line. The reversal occurred at the .10-.12 level, which is no surprise to me that the stock is now attempting to base at, after almost 2.5 years of gradual and steady decline. I don't see much yet on the daily chart to give me much more inclination that a move is imminent. That said, should management finally release material events and filings that prove that the debt levels have been reduced, the margins have increased, and the share structure is intact, then the fundamentals will result in an increased share price. Until then, not much to rely on with the charts. GLTA
 (0)
(0) (0)
(0)