IORG Daily Chart ~ A Reset of the Negative Indicat
Post# of 2561
Posted On: 05/21/2016 3:22:09 PM

IORG Daily Chart ~ A Reset of the Negative Indicators.........
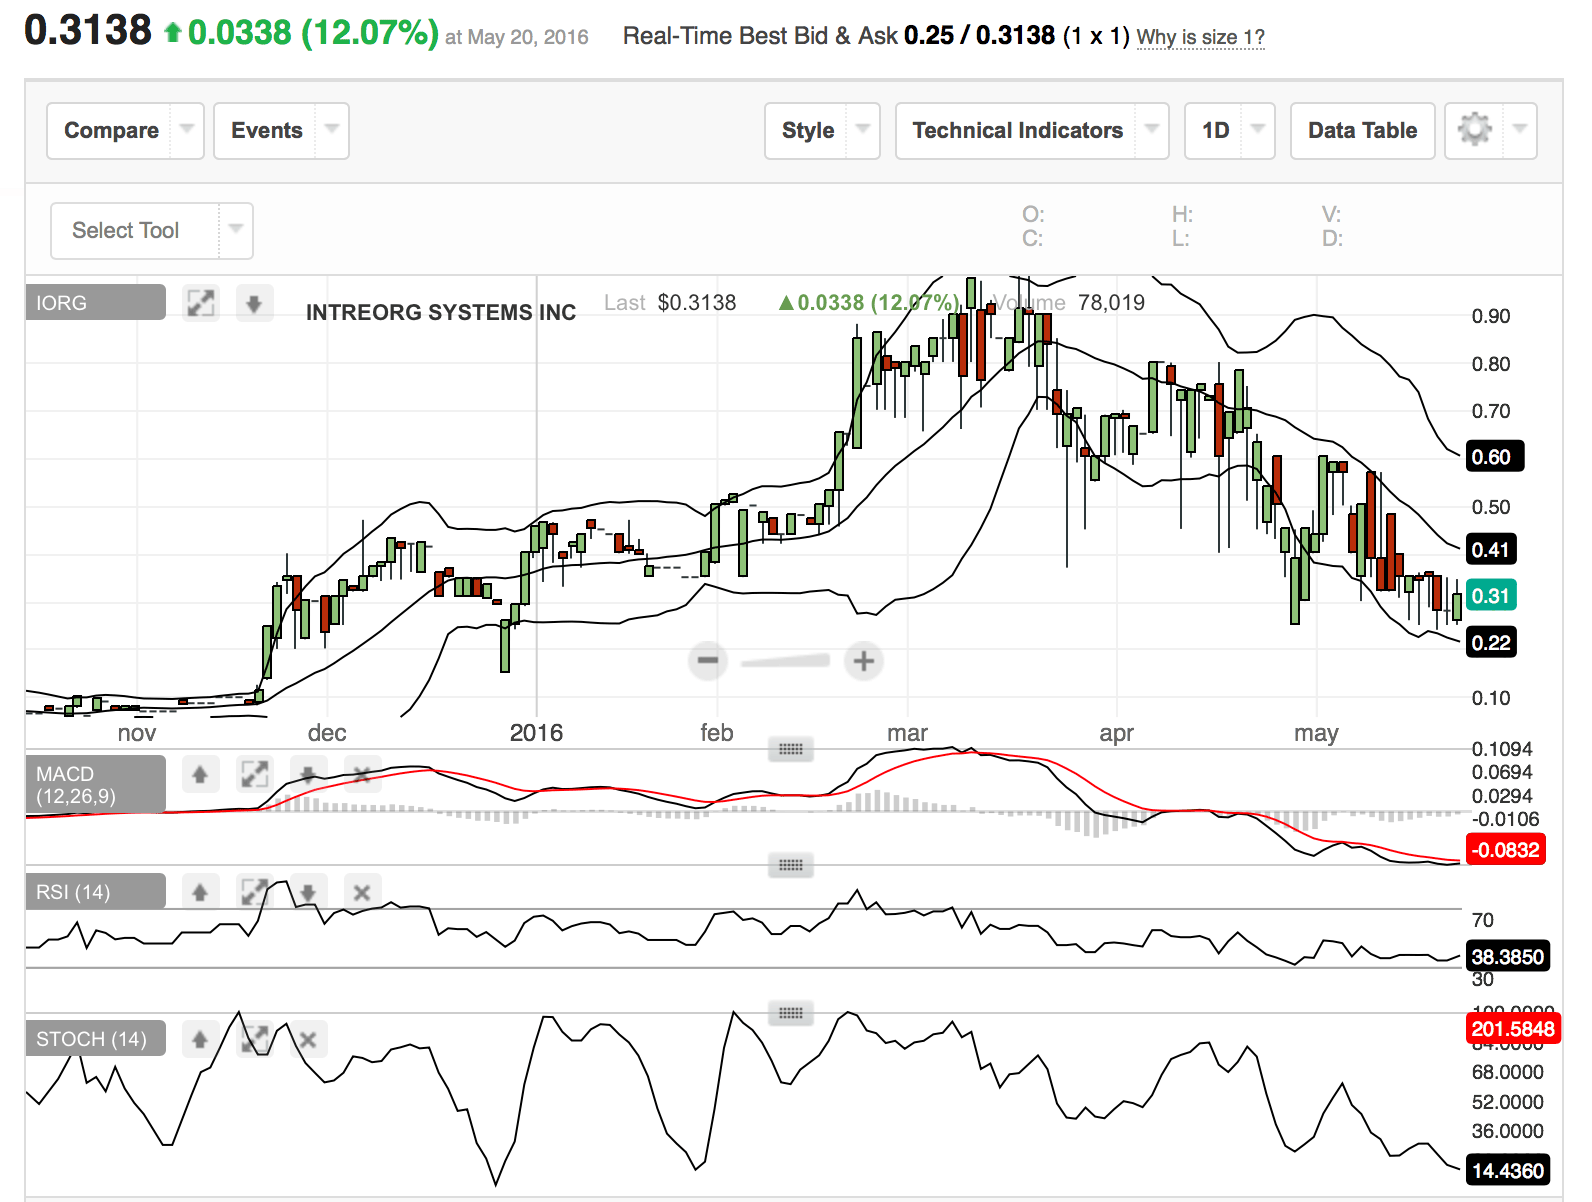
I initially shared IORG when it was trading in the .08-.15 range in mid November. The stock has since witnessed a move to as high as .975 before trading into very overbought technical levels. As the RSI reached levels well into the Nose Bleed Zone of above 70, the FullSto and MACDs also reached very high levels. The obvious move for those swing trading a stock is to pay attention to the technical indicators and make your calculated entries and exits based on them.
As many can see, during the last few months of trying on IORG, the indicators have now reset and are close to executing their crossovers once again to the positive side. Over the last three weeks, investors have absorbed well over 800,000 shares of the stock in the hopes of seeing the next leg to the upside begin after months of waiting while the share price fell from .975 to the current lows in the mid .20s and .30s. The RSI has been holding just above the 30 line. The Sto is trending at its extreme lows matching the levels seen in Nov and late Jan just prior to the large moves to the upside. The MACD is in very oversold territory, flattening out, and it appears ready to crossover to a buy signal. Should IORG begin to rise in short order, it's my observation of the technicals that the next move could take the stock well over $1.00, but not in a few days as some compensated pump and dump POS might do.
In discussions with management recently, a number of shareholders have been informed that financials are coming along with material 8Ks. If that's the case, I would expect to see the OTC Markets Stop Sign to be removed in June. I'm optimistic that the fundamentals can then be studied to give us an idea of what this company is building after months of silence. The share structure is very low with a newly updated OS of 15.54MM. The estimated float is under 5.5MM. I like IORG at these levels. Could we see another move as we did from .08 to .975 over the next few weeks? A similar percentage gain would take the stock to over $2.50. Can we see that over a 4 month period? Who knows. Time will tell.
Trade Smart
 (0)
(0) (0)
(0)