RXMD ~ A Reversal to the Upside RXMD is a favor
Post# of 2561
Posted On: 05/21/2016 12:51:22 PM

RXMD ~ A Reversal to the Upside
RXMD is a favorite stock among a few of us. Initially shared with us by MoneyForNuthin, it's treated us well, and especially for those that have utilized the indicators for calculated entries and exits. The recent entries over the last few days in the low to mid .03s, have no seen a move into the .04s
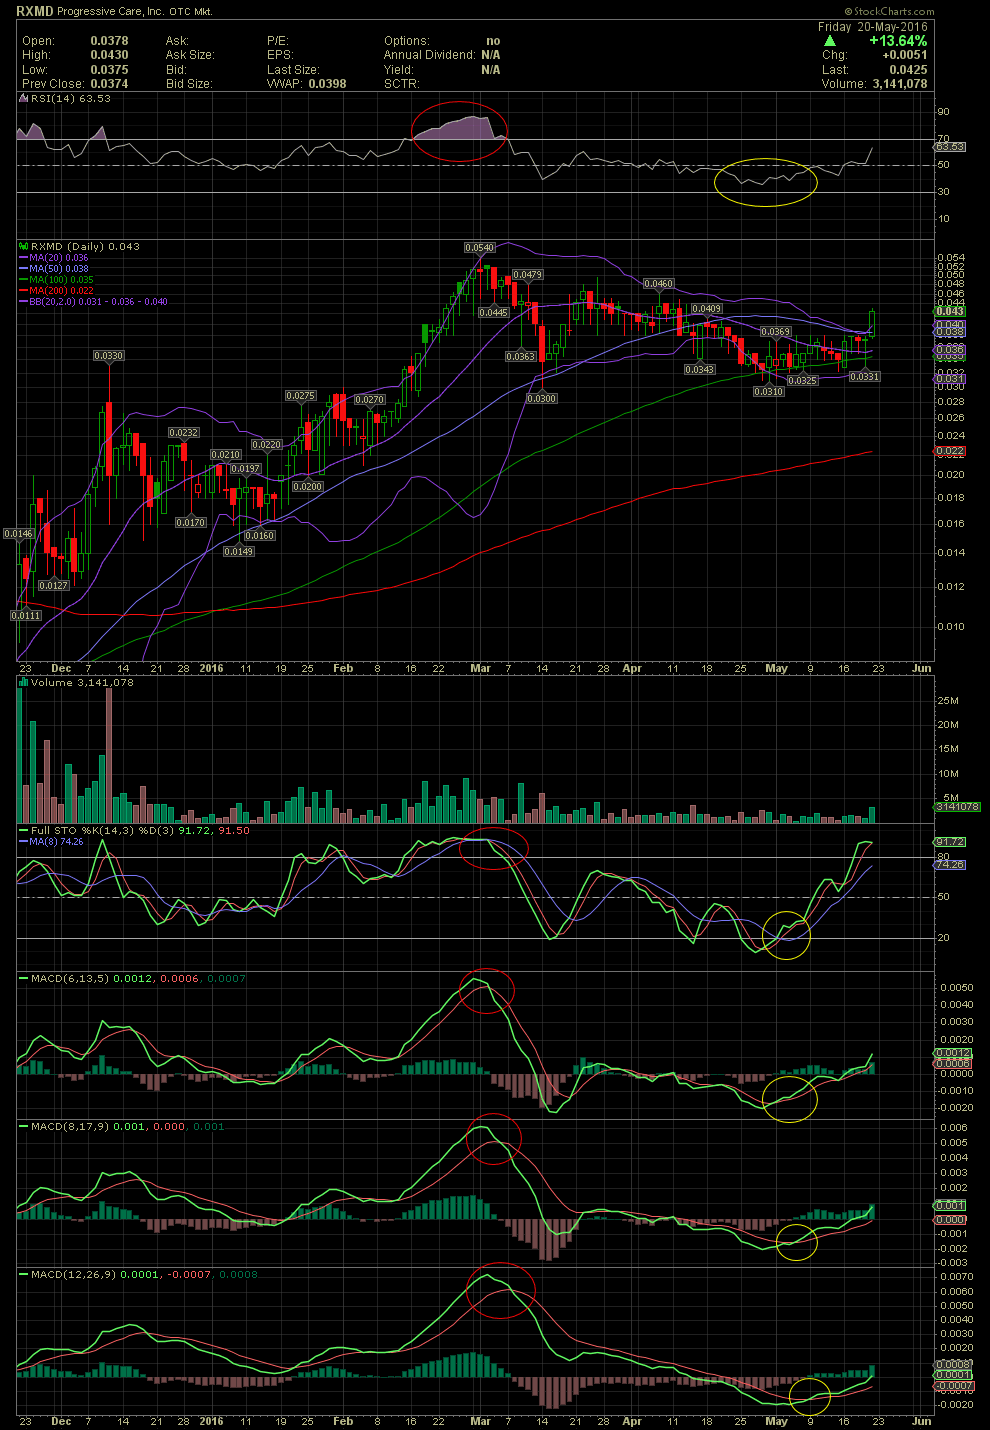
Some of you may recall a number of posts back in March when there was discussion pertaining to the RSI as being the 'Power Zone'. Those following along completely understand that the RSI in the 70 and higher level is actually a caution sign as to the underlying security being overbought for the short term. Inversely, the RSI near its 30 level or below that level signifies that a security is getting to or already in the oversold area. Don't use just the RSI for your entries and exits, though, as it is a slow and lagging indicator. Use it with other indicators. My favorites are the FullSto and MACDs, which can be seen on the chart below.
As one can see below, when I was being accused of being a robot trader among a few other things, I was the one stating that the RSI being in the so called 'Power Zone' back in March, the fact of the matter was that RXMD had it's nice move, but it was time to take profits in the .04s to .05s based upon the indicators that I use.
So, here we are, just 70-80 days later, the so called 'Power Zone' was really the 'Nose Bleed Zone', we took our profits, and waited for the next entry. That entry came to us this over the last few trading days when the FullSto and MACDs executed a positive crossover. Since then, the stock has rallied from lows in the .031/.032 and is now up over 30%.
People, use the indicators to your advantage, and don't fall for message board information fables such as the 'Power Zone' being a great indicator for further upside when in the overbought levels of 70 and higher. No one call tell you how much further a stock might move when the RSI is over 70, but I can tell you that the stock will always pullback from that 'Nose Bleed Zone'.
Trade Smart!
RXMD is a favorite stock among a few of us. Initially shared with us by MoneyForNuthin, it's treated us well, and especially for those that have utilized the indicators for calculated entries and exits. The recent entries over the last few days in the low to mid .03s, have no seen a move into the .04s
Some of you may recall a number of posts back in March when there was discussion pertaining to the RSI as being the 'Power Zone'. Those following along completely understand that the RSI in the 70 and higher level is actually a caution sign as to the underlying security being overbought for the short term. Inversely, the RSI near its 30 level or below that level signifies that a security is getting to or already in the oversold area. Don't use just the RSI for your entries and exits, though, as it is a slow and lagging indicator. Use it with other indicators. My favorites are the FullSto and MACDs, which can be seen on the chart below.
As one can see below, when I was being accused of being a robot trader among a few other things, I was the one stating that the RSI being in the so called 'Power Zone' back in March, the fact of the matter was that RXMD had it's nice move, but it was time to take profits in the .04s to .05s based upon the indicators that I use.
So, here we are, just 70-80 days later, the so called 'Power Zone' was really the 'Nose Bleed Zone', we took our profits, and waited for the next entry. That entry came to us this over the last few trading days when the FullSto and MACDs executed a positive crossover. Since then, the stock has rallied from lows in the .031/.032 and is now up over 30%.
People, use the indicators to your advantage, and don't fall for message board information fables such as the 'Power Zone' being a great indicator for further upside when in the overbought levels of 70 and higher. No one call tell you how much further a stock might move when the RSI is over 70, but I can tell you that the stock will always pullback from that 'Nose Bleed Zone'.
Trade Smart!
 (1)
(1) (0)
(0)