IFBC Daily Chart ~ Re-Entries This Past Week Pl
Post# of 2561
Posted On: 01/31/2016 1:06:28 PM

IFBC Daily Chart ~ Re-Entries This Past Week
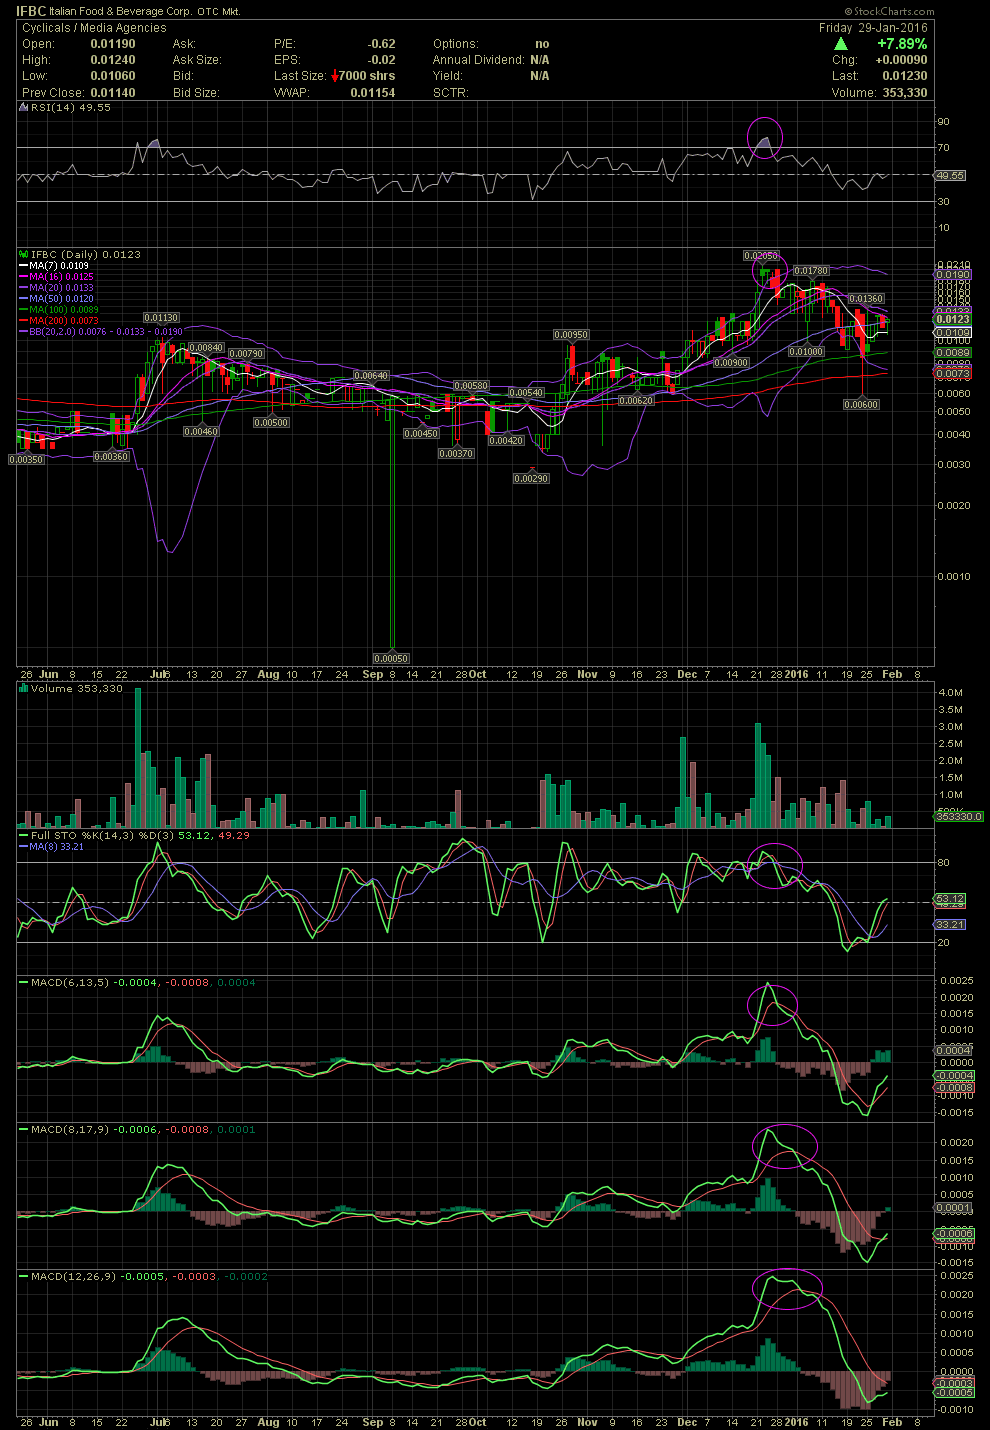
Please link back to my previous comments as to our exits from IFBC when the indicators suggested a sell due to very overbought levels of the FullSto and MACDs. The RSI was also saying "Sell" while the naive were screaming "Power Zone". For those of you a little unfamiliar with my charting and interpretation of the technicals, overbought conditions to me can easily be seen on this chart simply by looking at the RSI, FullSto and MACDs which I have circled in late December. Since that sell signal, we were waiting for the indicators to reset to better levels for a re-entry. That occurred with small amounts this week for a few of us that I'm in contact with. IFBC saw a steep decline from the top at .0205 to an intraday low of .006, although the volume under .0089 was very low. It was interesting to see the stock price well outside the lower bollie. And again, what moves outside the bollinger bands always comes back inside the bands. Since that intraday low of .006, the share price has more than doubled to Friday's close of .0123. Just ahead is the MA20, aka middle bollie, at .0133. A close back above that moving average would indicate the next leg up is underway. I haven't yet circled the crossovers of the FullSto and MACDs, but one can see 3 of 4 have already shifted to a positive position to the green. Fundamentally, a few close to the company believe IFBC could be a .20 stock in 12-24 months. I'll continue to swing trade some or all of my position as the chart 'talks' to me. GLTA
Please link back to my previous comments as to our exits from IFBC when the indicators suggested a sell due to very overbought levels of the FullSto and MACDs. The RSI was also saying "Sell" while the naive were screaming "Power Zone". For those of you a little unfamiliar with my charting and interpretation of the technicals, overbought conditions to me can easily be seen on this chart simply by looking at the RSI, FullSto and MACDs which I have circled in late December. Since that sell signal, we were waiting for the indicators to reset to better levels for a re-entry. That occurred with small amounts this week for a few of us that I'm in contact with. IFBC saw a steep decline from the top at .0205 to an intraday low of .006, although the volume under .0089 was very low. It was interesting to see the stock price well outside the lower bollie. And again, what moves outside the bollinger bands always comes back inside the bands. Since that intraday low of .006, the share price has more than doubled to Friday's close of .0123. Just ahead is the MA20, aka middle bollie, at .0133. A close back above that moving average would indicate the next leg up is underway. I haven't yet circled the crossovers of the FullSto and MACDs, but one can see 3 of 4 have already shifted to a positive position to the green. Fundamentally, a few close to the company believe IFBC could be a .20 stock in 12-24 months. I'll continue to swing trade some or all of my position as the chart 'talks' to me. GLTA
 (0)
(0) (0)
(0)