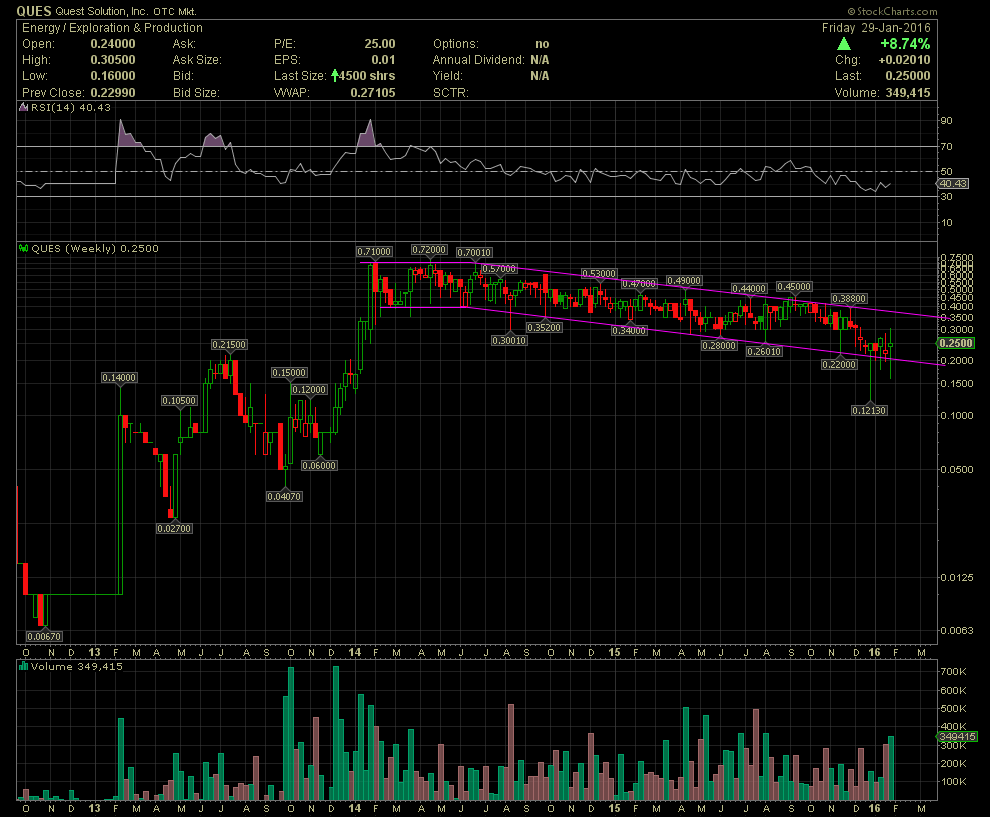
QUES Weekly Chart ~ I'm posting the QUES weekl
Post# of 2561

I'm posting the QUES weekly chart, so new comers can see the trading history since QUES transitioned from a shell to a revenue producing machine. The stock has been in a declining channel since the summer of 2014. In my previous post I mentioned a break and close above .38-.45 as a strong technical event that would suggest a much higher share price. Keep in mind, the triple tops at the .70-.72 of early 2014 were set with no revenues at the time. QUES now will show $90,000,000 or more over the next 12 months. Could the share price double, triple or increase 5 to 7 fold over the next few months as fundamentals establish a real valuation? We shall see. GLTA

 (0)
(0) (0)
(0)