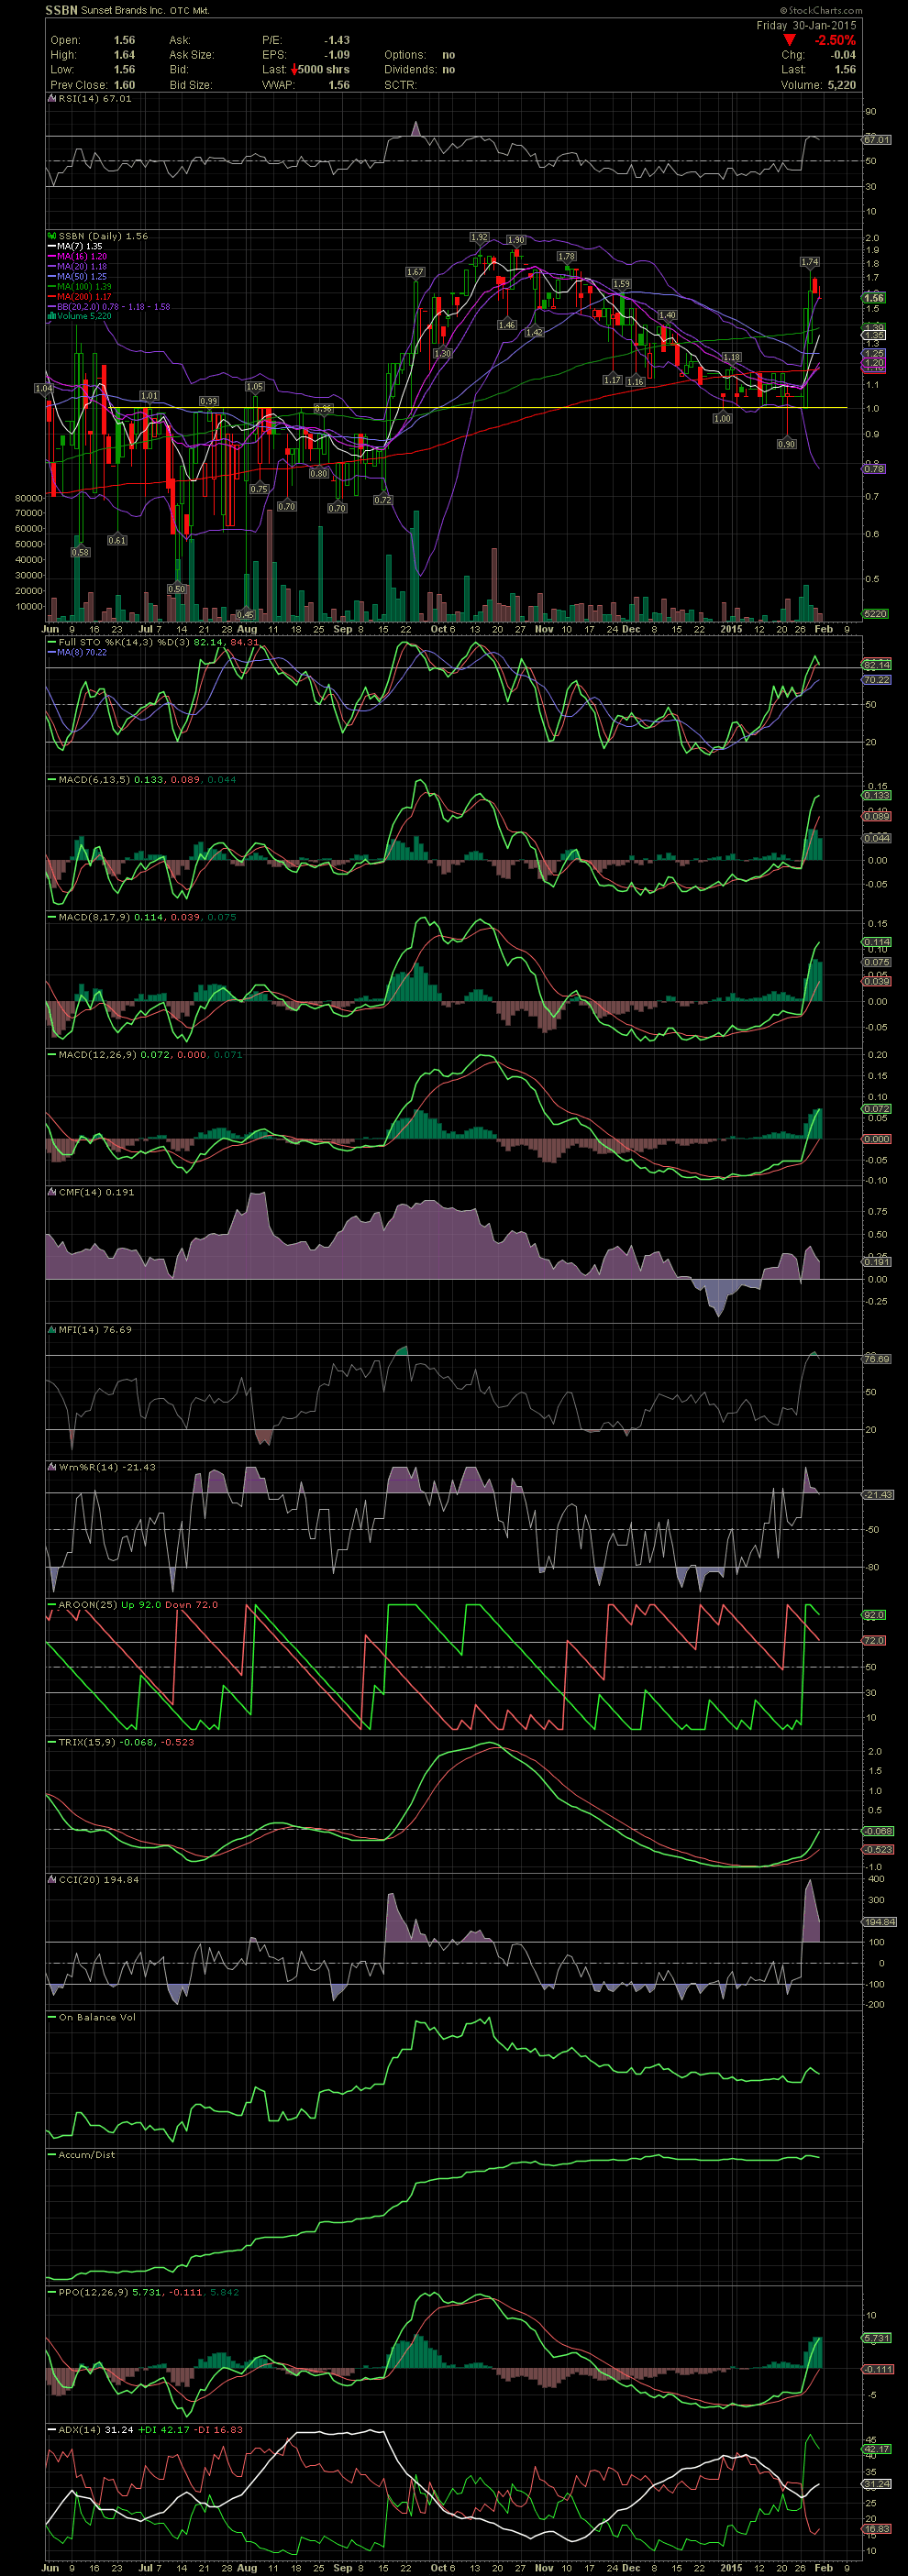
SNST Daily Chart ~ Share Price Responding Nicely t
Post# of 84
SSBN is now trading under its new symbol, SNST
Since my last Daily Chart of Dec 29, SNST has risen sharply from the support line at $1.00 on the chart below with an intraday low set at .90 on January 21. The mention of the chart resetting from overbought conditions to oversold levels appears to have been correct. Charts and Technical Indicators are great tools. Since then, the FullSto and MACDs have all crossed over to the positive, and the stock ran from 1.00 on Tuesday morning to 1.74 on Wednesday while closing at 1.56 on Friday with just three trades for the day. Another favorite, longer term indicator I like is the TRIX. It's also undergoing a positive crossover. Look at the move of September the last time the TRIX moved to the upside with a positive divergence. Although based solely only technicals, I think the previous highs, up to 1.92 in October, will be taken out over the next few sessions. As the company continues to execute, I'm still looking for much higher share prices over the next 12 months. Long term holding periods for a few of us will be upon us in April. I'm hoping the stock is close to $10.00 than $1.00 by then. GLTA

 (0)
(0) (0)
(0)