QUES Weekly Chart ~ The Big Picture I wanted to
Post# of 2561
Posted On: 11/23/2014 11:36:50 AM

QUES Weekly Chart ~ The Big Picture
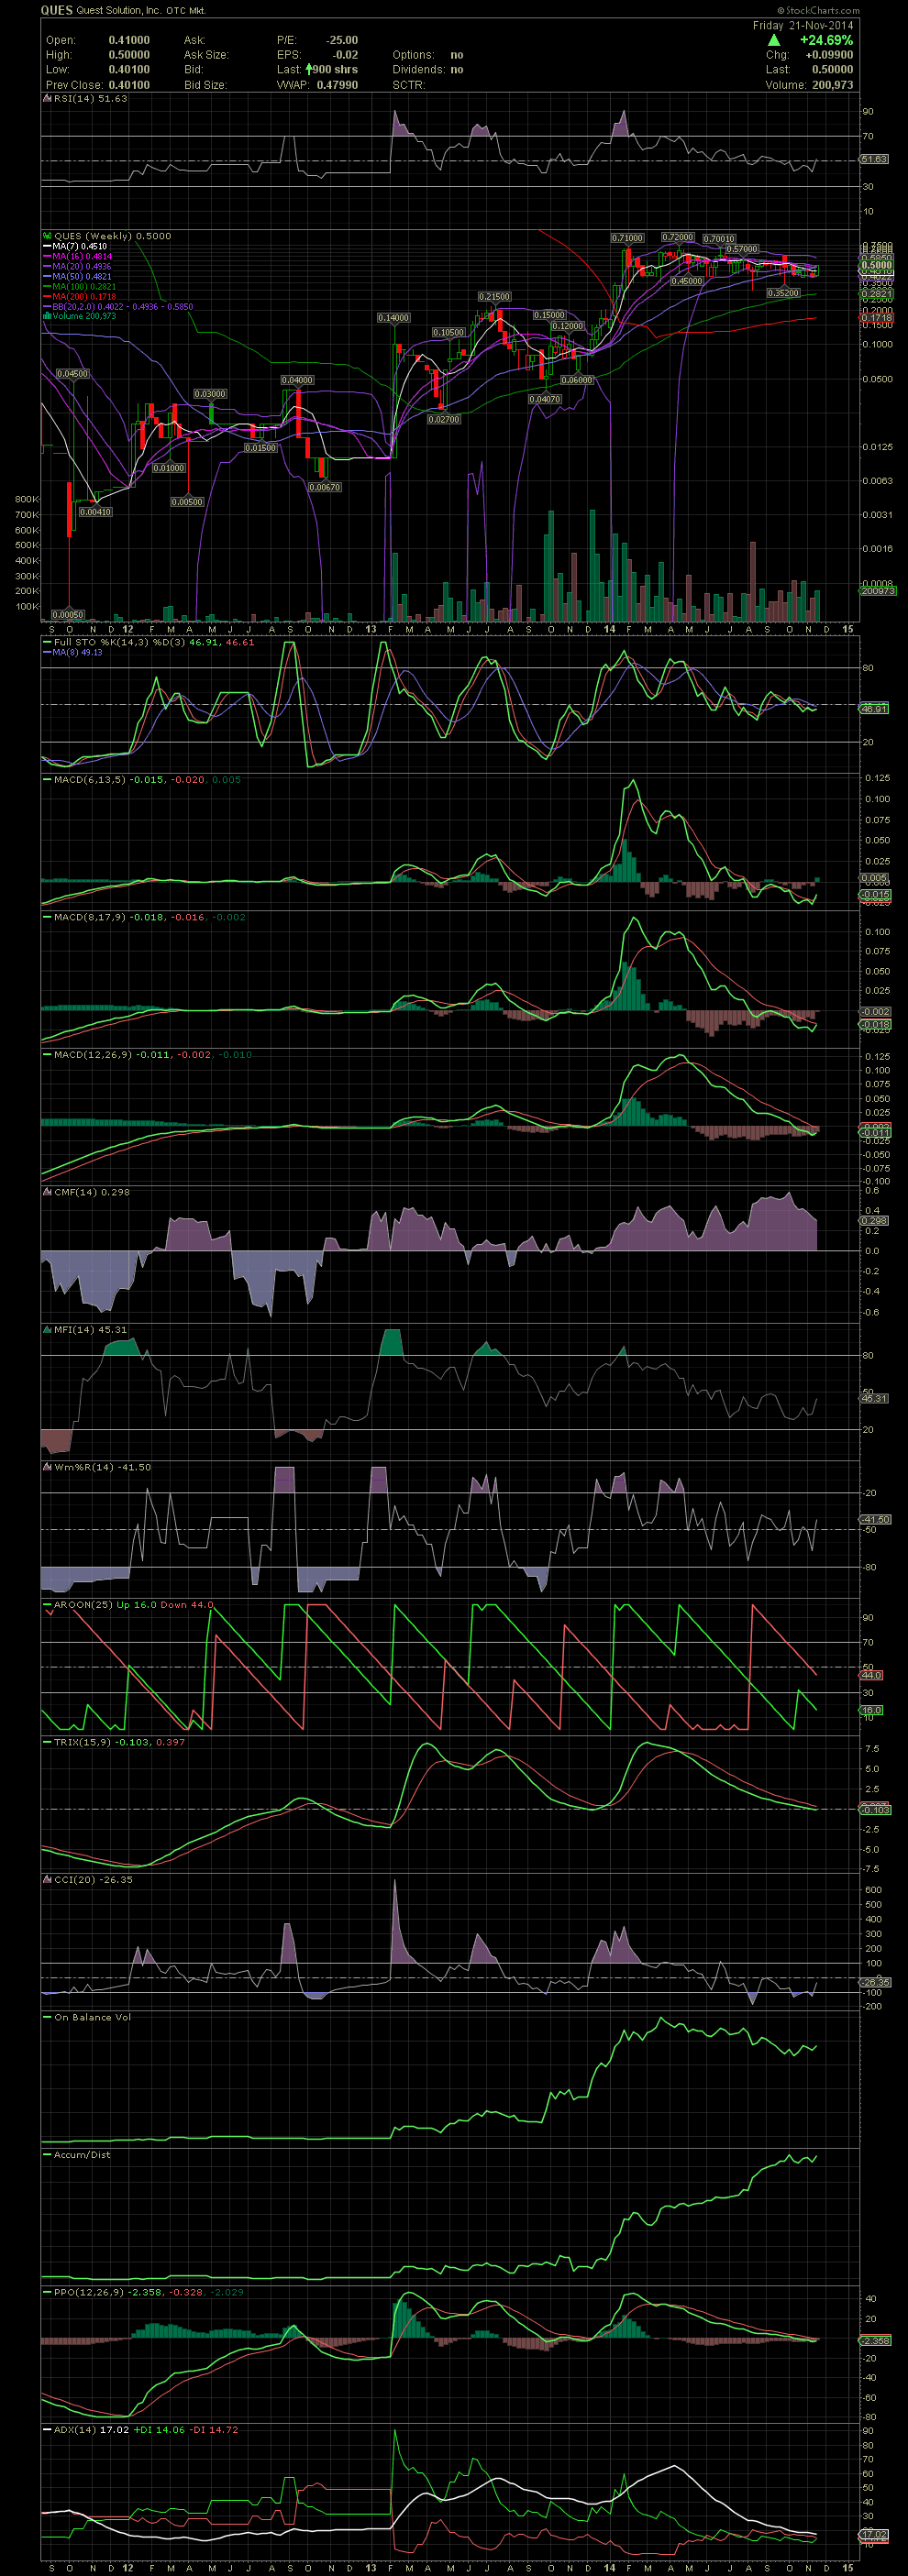
I wanted to share the bigger view of QUES with a weekly chart. During the nine month channeling of the stock, please note the FullSto as it has held near the 50 line. That is typical of a stock channeling and consolidating after a large move higher. In the case of QUES, this drifting occurred after the move from .04 to .70, which began last October. Now scroll down to the three MACDs that I use. All three began curling to the upside last week, with the first already showing a positive crossover. The second should cross as early as Monday. The standard MACD12 is probably a week away from confirming a buy signal for QUES. The last time all three had a positive crossover on the weekly chart was in mid December, 2013, just before the move from .07/.08 to .71 by late January. I'm looking for an imminent move to new highs. GLTA
I wanted to share the bigger view of QUES with a weekly chart. During the nine month channeling of the stock, please note the FullSto as it has held near the 50 line. That is typical of a stock channeling and consolidating after a large move higher. In the case of QUES, this drifting occurred after the move from .04 to .70, which began last October. Now scroll down to the three MACDs that I use. All three began curling to the upside last week, with the first already showing a positive crossover. The second should cross as early as Monday. The standard MACD12 is probably a week away from confirming a buy signal for QUES. The last time all three had a positive crossover on the weekly chart was in mid December, 2013, just before the move from .07/.08 to .71 by late January. I'm looking for an imminent move to new highs. GLTA
 (0)
(0) (0)
(0)