QUES Daily Chart ~ A Closer Look at Today's Tradin
Post# of 2561
Posted On: 11/23/2014 11:18:14 AM

QUES Daily Chart ~ A Closer Look at Today's Trading
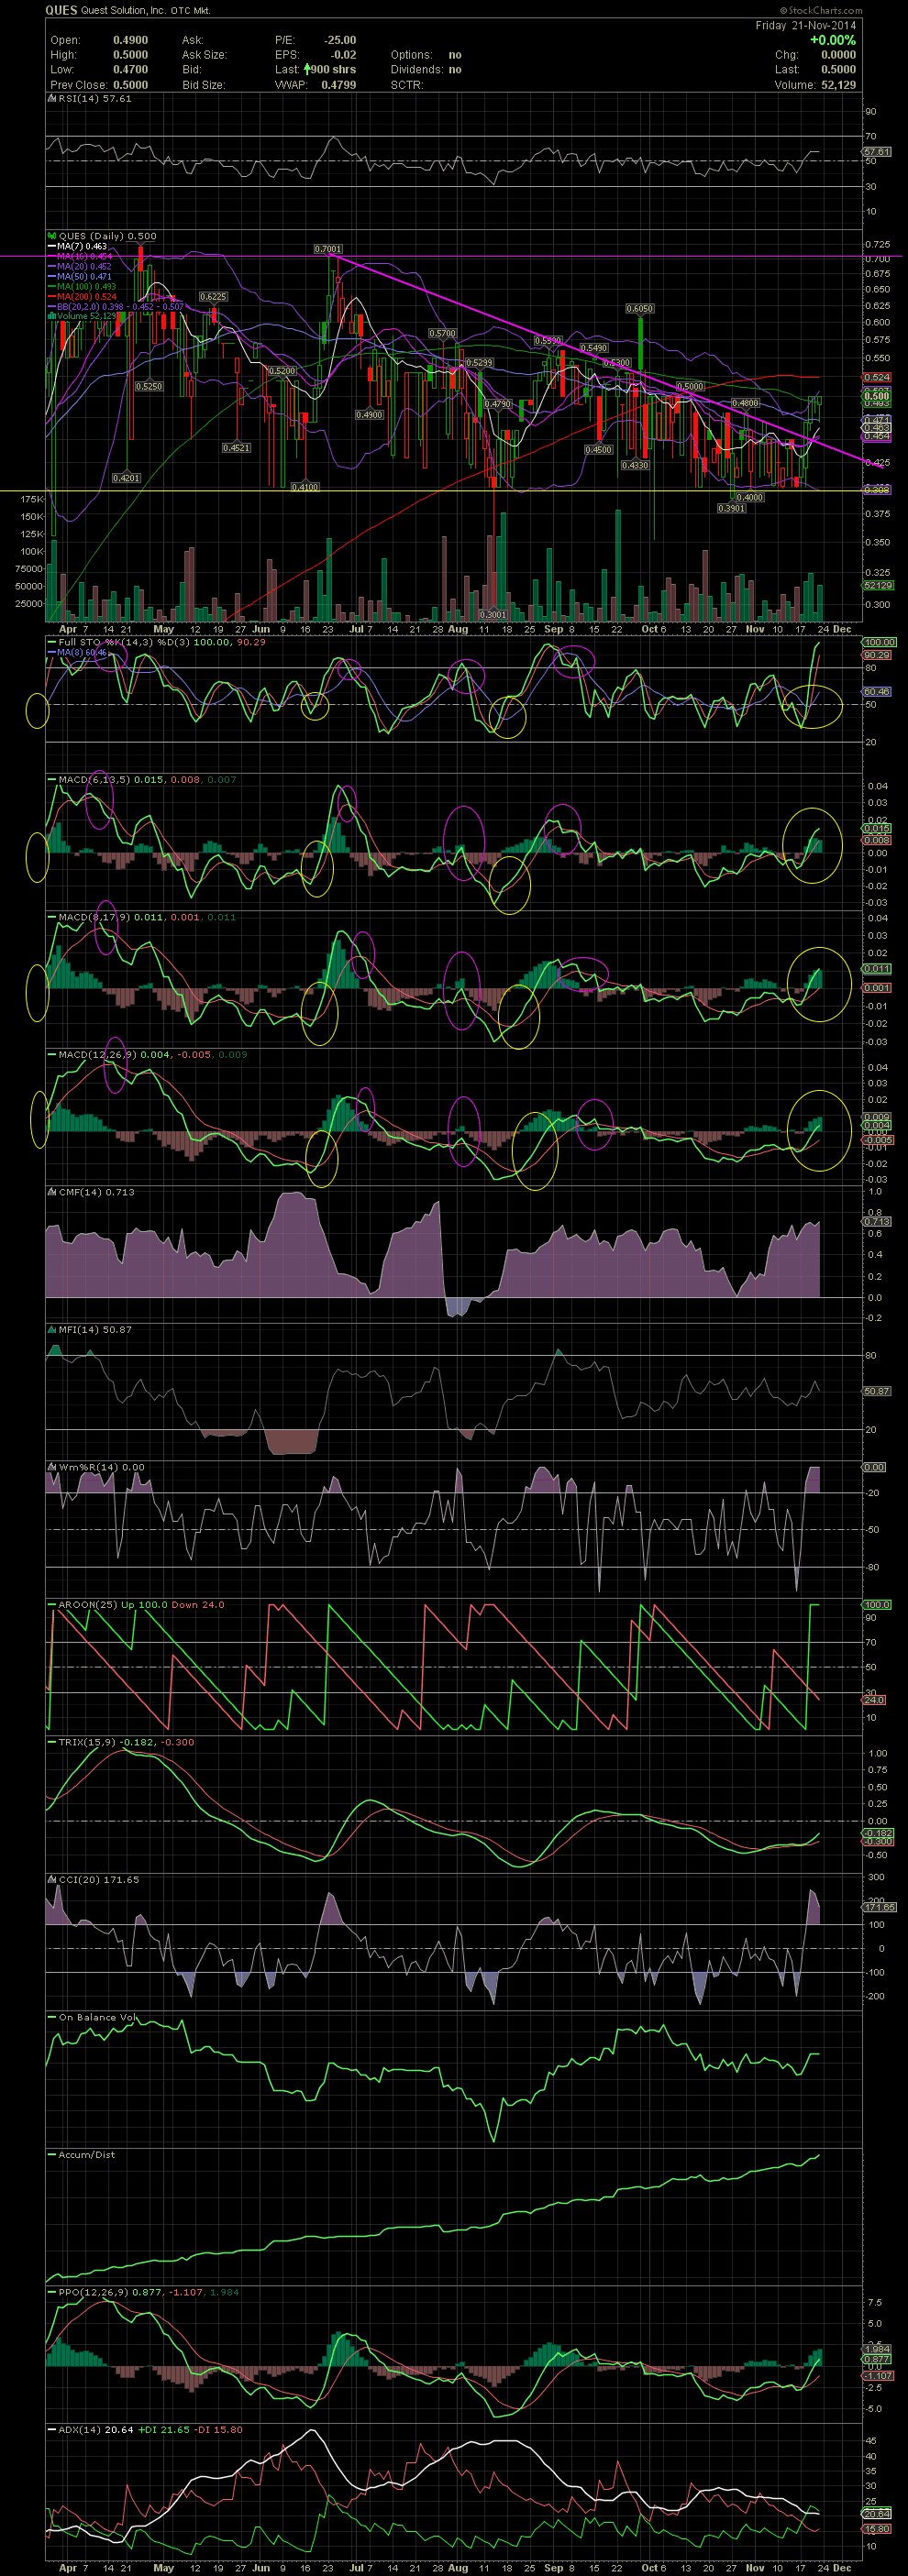
As I mentioned in the previous post, the stock has moved above its declining tops line and closed above it for four consecutive days. Additionally, QUES has now held above the MA50 for three straight days. Up next is the MA200 at .524. A close above .50, the recent highs of October and .559, the high late August, would bode well for an attempt for new highs above the low .70s. The FullSto and MACDs all triggered a positive crossover late last week and are showing nice divergence. And even though I have mentioned often in the past that QUES is not a chart play, it is comforting to see the technicals begin to show that another leg up might be underway. A break above the old highs in the low .70s would bring into play a potential move over 1.00+. Based on valuations alone (please read the latest filings), QUES should be trading at 1.50 already imo. GLTA
As I mentioned in the previous post, the stock has moved above its declining tops line and closed above it for four consecutive days. Additionally, QUES has now held above the MA50 for three straight days. Up next is the MA200 at .524. A close above .50, the recent highs of October and .559, the high late August, would bode well for an attempt for new highs above the low .70s. The FullSto and MACDs all triggered a positive crossover late last week and are showing nice divergence. And even though I have mentioned often in the past that QUES is not a chart play, it is comforting to see the technicals begin to show that another leg up might be underway. A break above the old highs in the low .70s would bring into play a potential move over 1.00+. Based on valuations alone (please read the latest filings), QUES should be trading at 1.50 already imo. GLTA
 (0)
(0) (0)
(0)