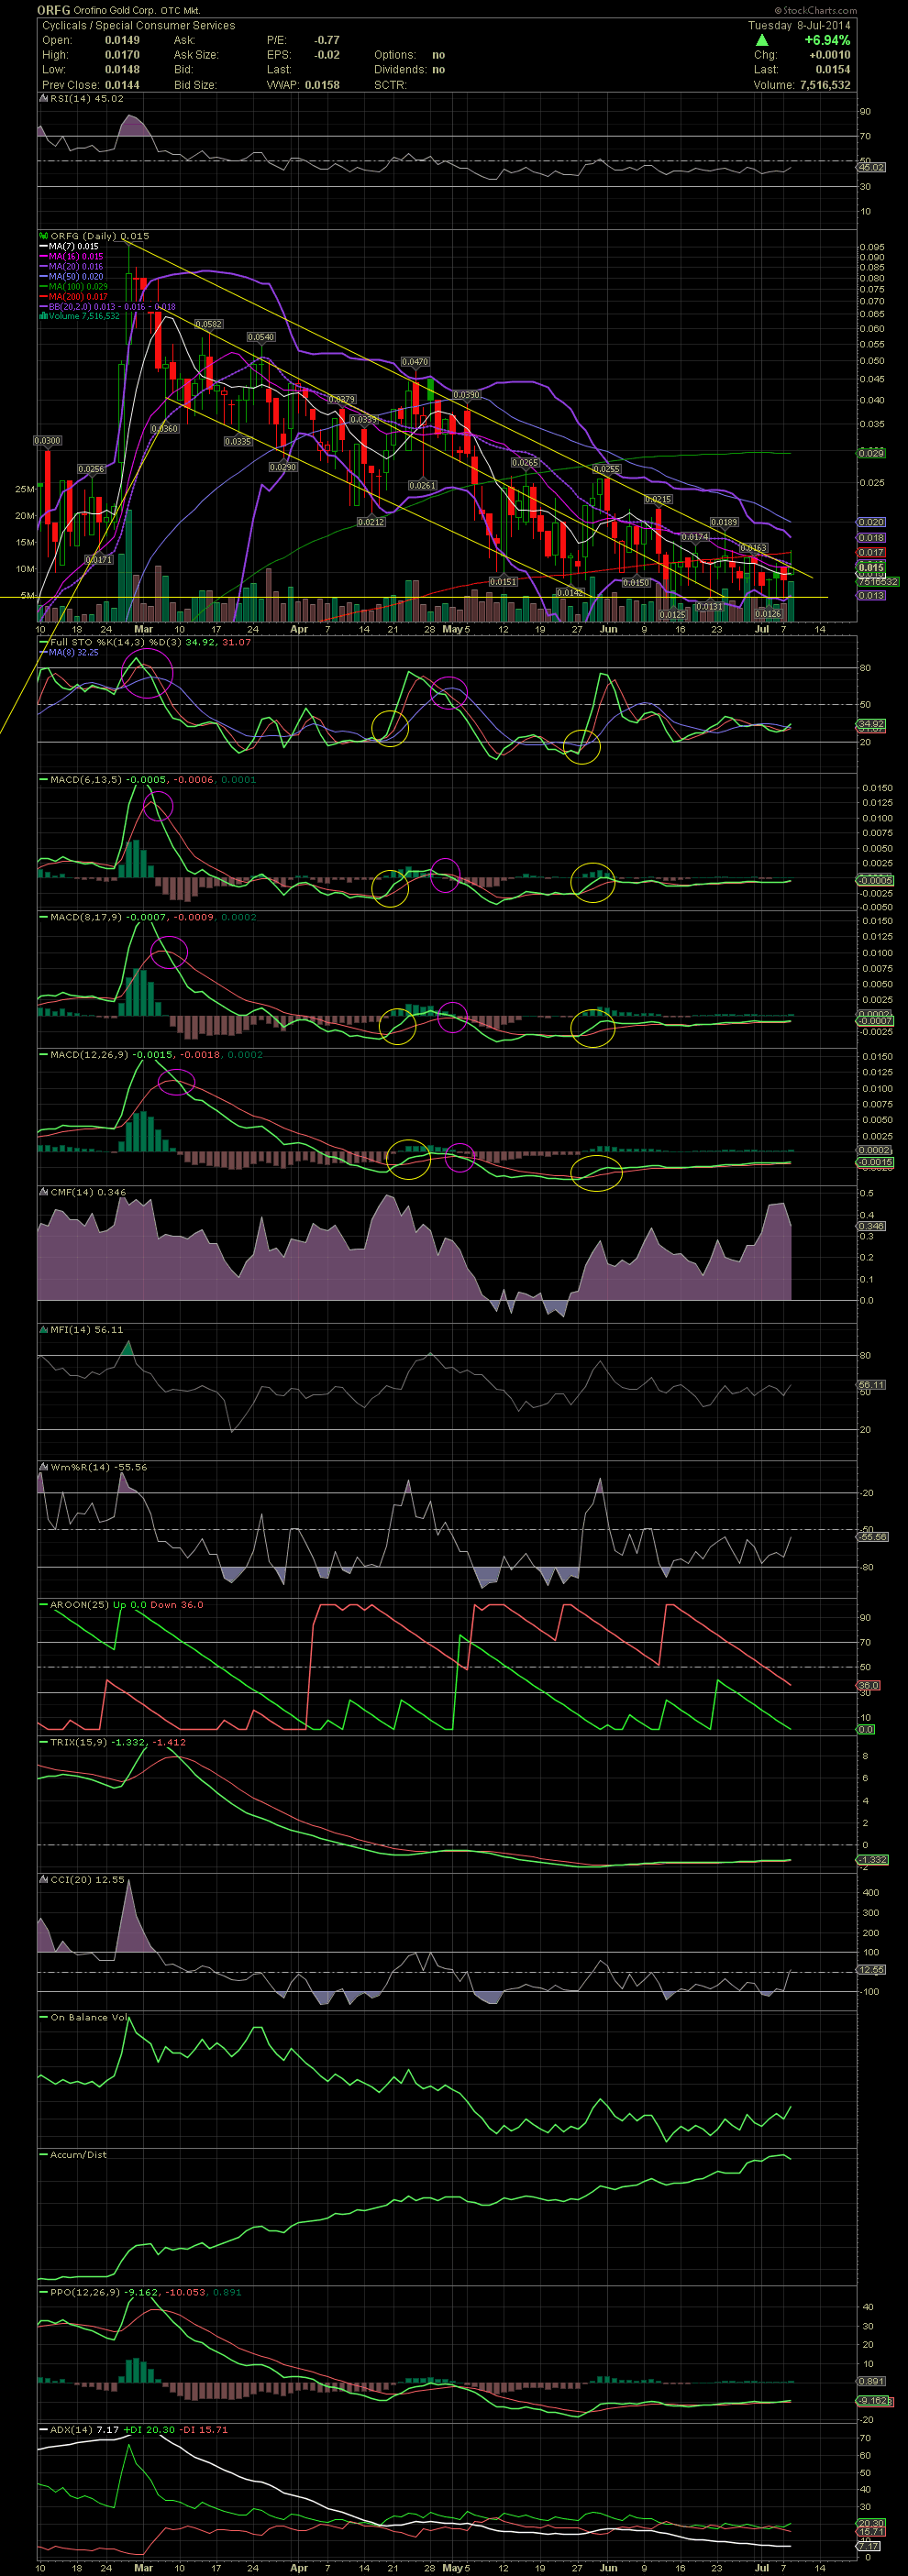
ORFG Daily Chart ~ Still Struggling to Breakout Ab
Post# of 2561

Just over four months in a declining channel in which the stock has failed to break above it's declining tops line but for very few intraday attempts. Today's action took the stock above the declining tops line only to smack into the MA200 at .017. The stock needs to close above .017 on big volume in order to confirm a new leg up. The MA50 would be the next target, just above .02. The FullSto and MACDs are just beginning to crossover but just in the early stages, so we'll need to see some green follow thru to confirm a buy signal there. ORFG has been a tough one, but if one had followed the chart since the high established at .095, one would have been able to sidestep the entire decline or at least been able to trade the channel as many have done. GLTA

 (0)
(0) (0)
(0)