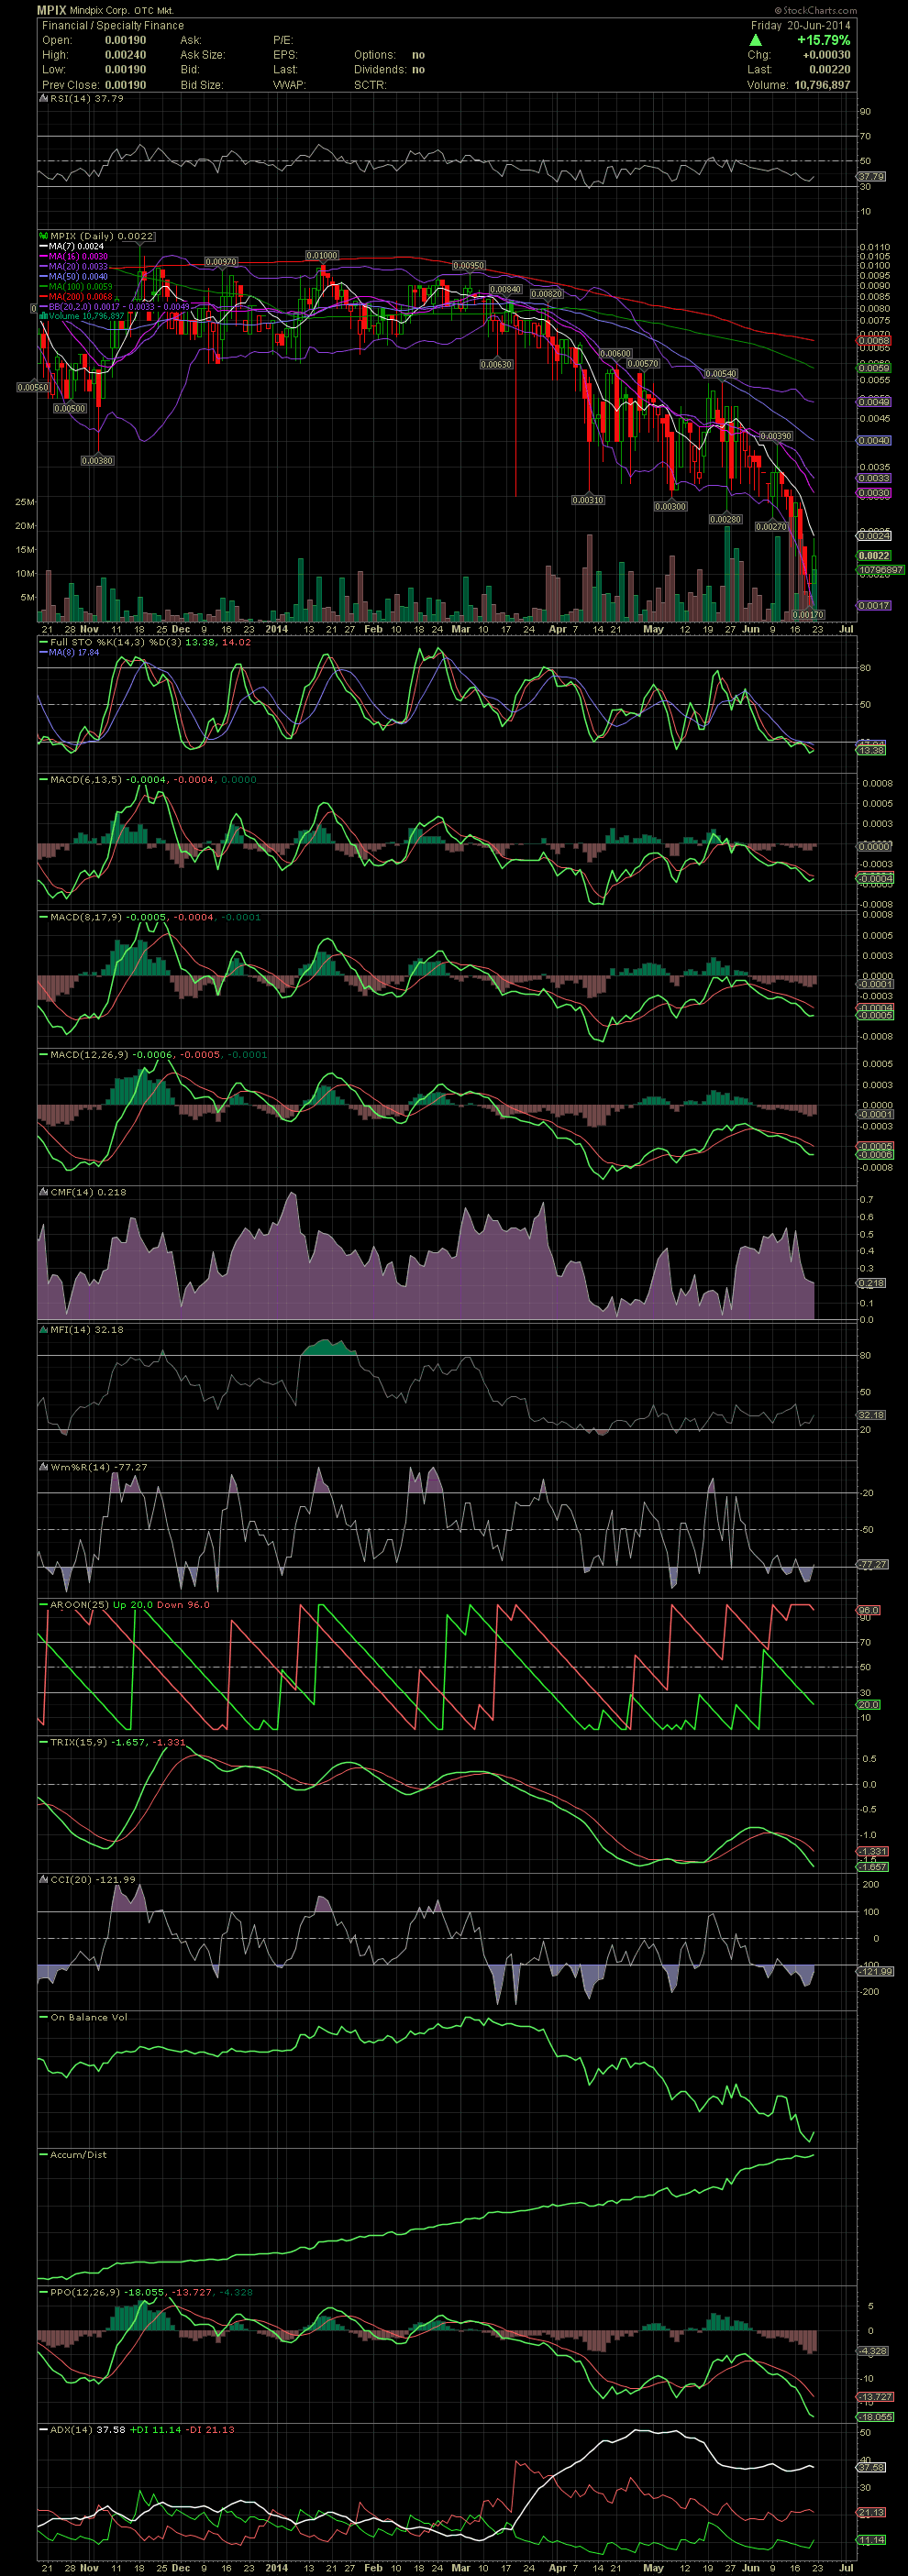
MPIX Daily Chart ~ Bounce of a Bottom? By req
Post# of 2561

By request, here's a chart of MPIX. Thursday doji with a new 12 month low saw the stock hit .0017 and bouncing to an intraday high of .0024 on Friday. There's not much to get excited about on this chart unless you are a believer in the MPIX management, which I am, and looking to add at prices that haven't been seen for well over one year. The FullSto and MACDs along with most every other indicator are near at at oversold levels. For someone with a longer term view in mind, the stock is very inexpensive imo. For the short term, it will be important for the stock to close over .003 to confirm Thursday as a bottom. GLTA

 (0)
(0) (0)
(0)