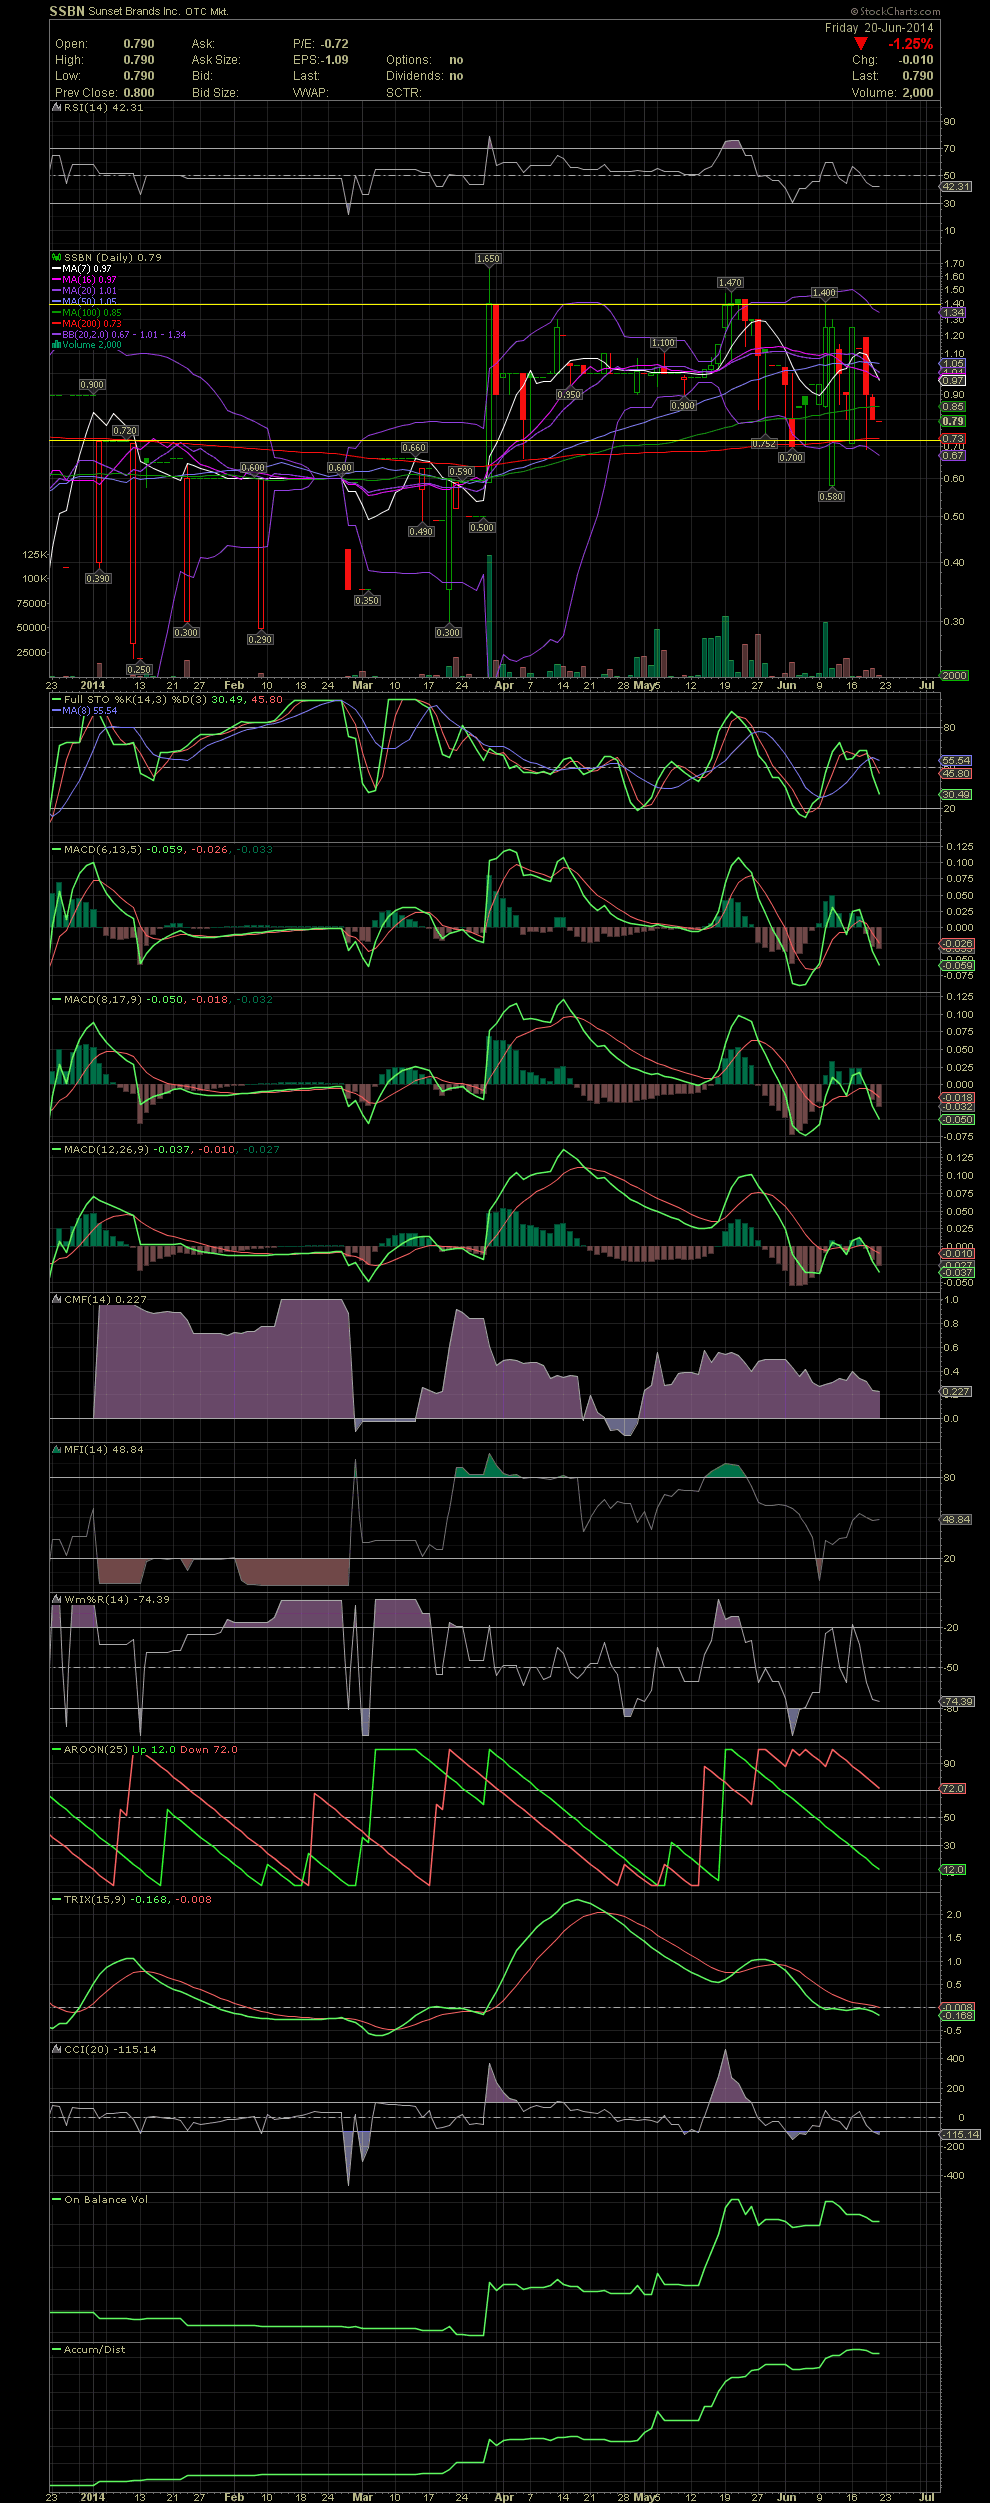
$SSBN Daily Chart ~ Trading in a Channel I ha
Post# of 2561

I had a request for a chart on SSBN. As many know, a few of us have been accumulating SSBN from the .70s to the 1.40s, although the stock has seen. SSBN is not a chart play for me at this time, although it's always smart to view your charts in the attempt to understand the trend. With SSBN near the lower end of its 2.5 month sideways channel, I would be bidding in the .80s if one was interested in accumulating a few shares. Should one be looking to add a substantial position, imo they will have to up their bids into the low 1.00s to 1.20. By size, I'm taking about a position of 30k or more. Outside of a few days with volume above 25k, this one is a hard one to accumulate a large position in due to the OS of approx 8.1 million and a float of 1.9 million. GLTA

 (0)
(0) (0)
(0)