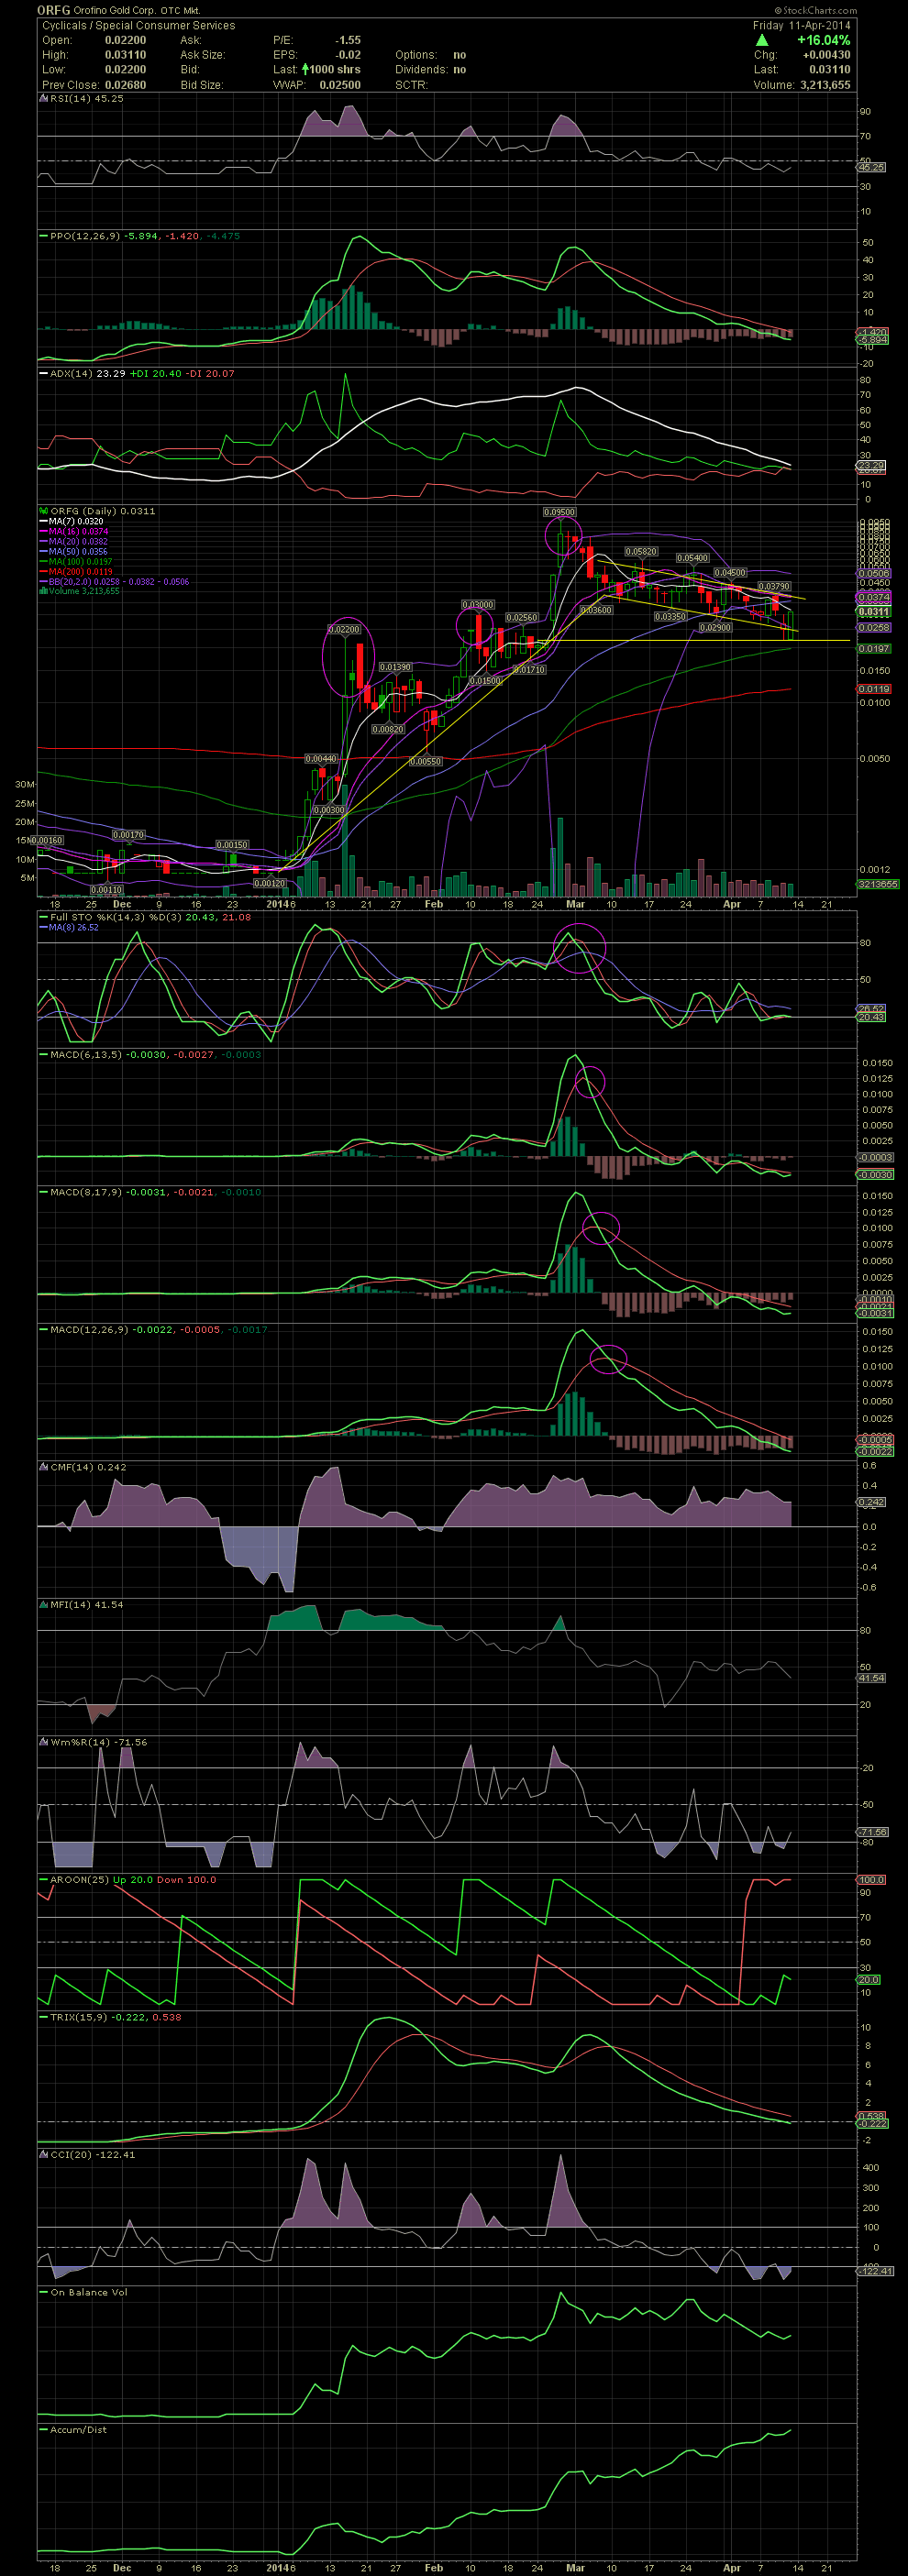
$ORFG Daily Chart ~ Time to Move Back Up? Thi
Post# of 2561
This last week saw ORFG fail to break above the declining tops line in place since early March. The result was yet another decline to the lower portion of the declining channel. On Thursday and Friday, the share price actually dipped below that level and tested the horizontal support line which also served as the point of closing the gap of late February. I guess a few others were watching that same thing as the stock rebounded from .022 to .0311 and closing at the high of the day. A close above .0379 on volume would set ORFG up for tests of the previous highs of .045, .054, .0582 and eventually .095. The FullSto and first two of the MACDs have leveled out and started their curls to a positive crossover. The 12d MACD shouldn't take much longer. I added almost everyday this last week, but as is almost always the case with declining indicators it was yet another strategy of attempting to catch a falling knife. I got sliced up a bit, but I'm looking for a big break to new highs over the next couple of weeks based on very strong rumors of news and valuations. Fingers crossed! GLTA

 (0)
(0) (0)
(0)