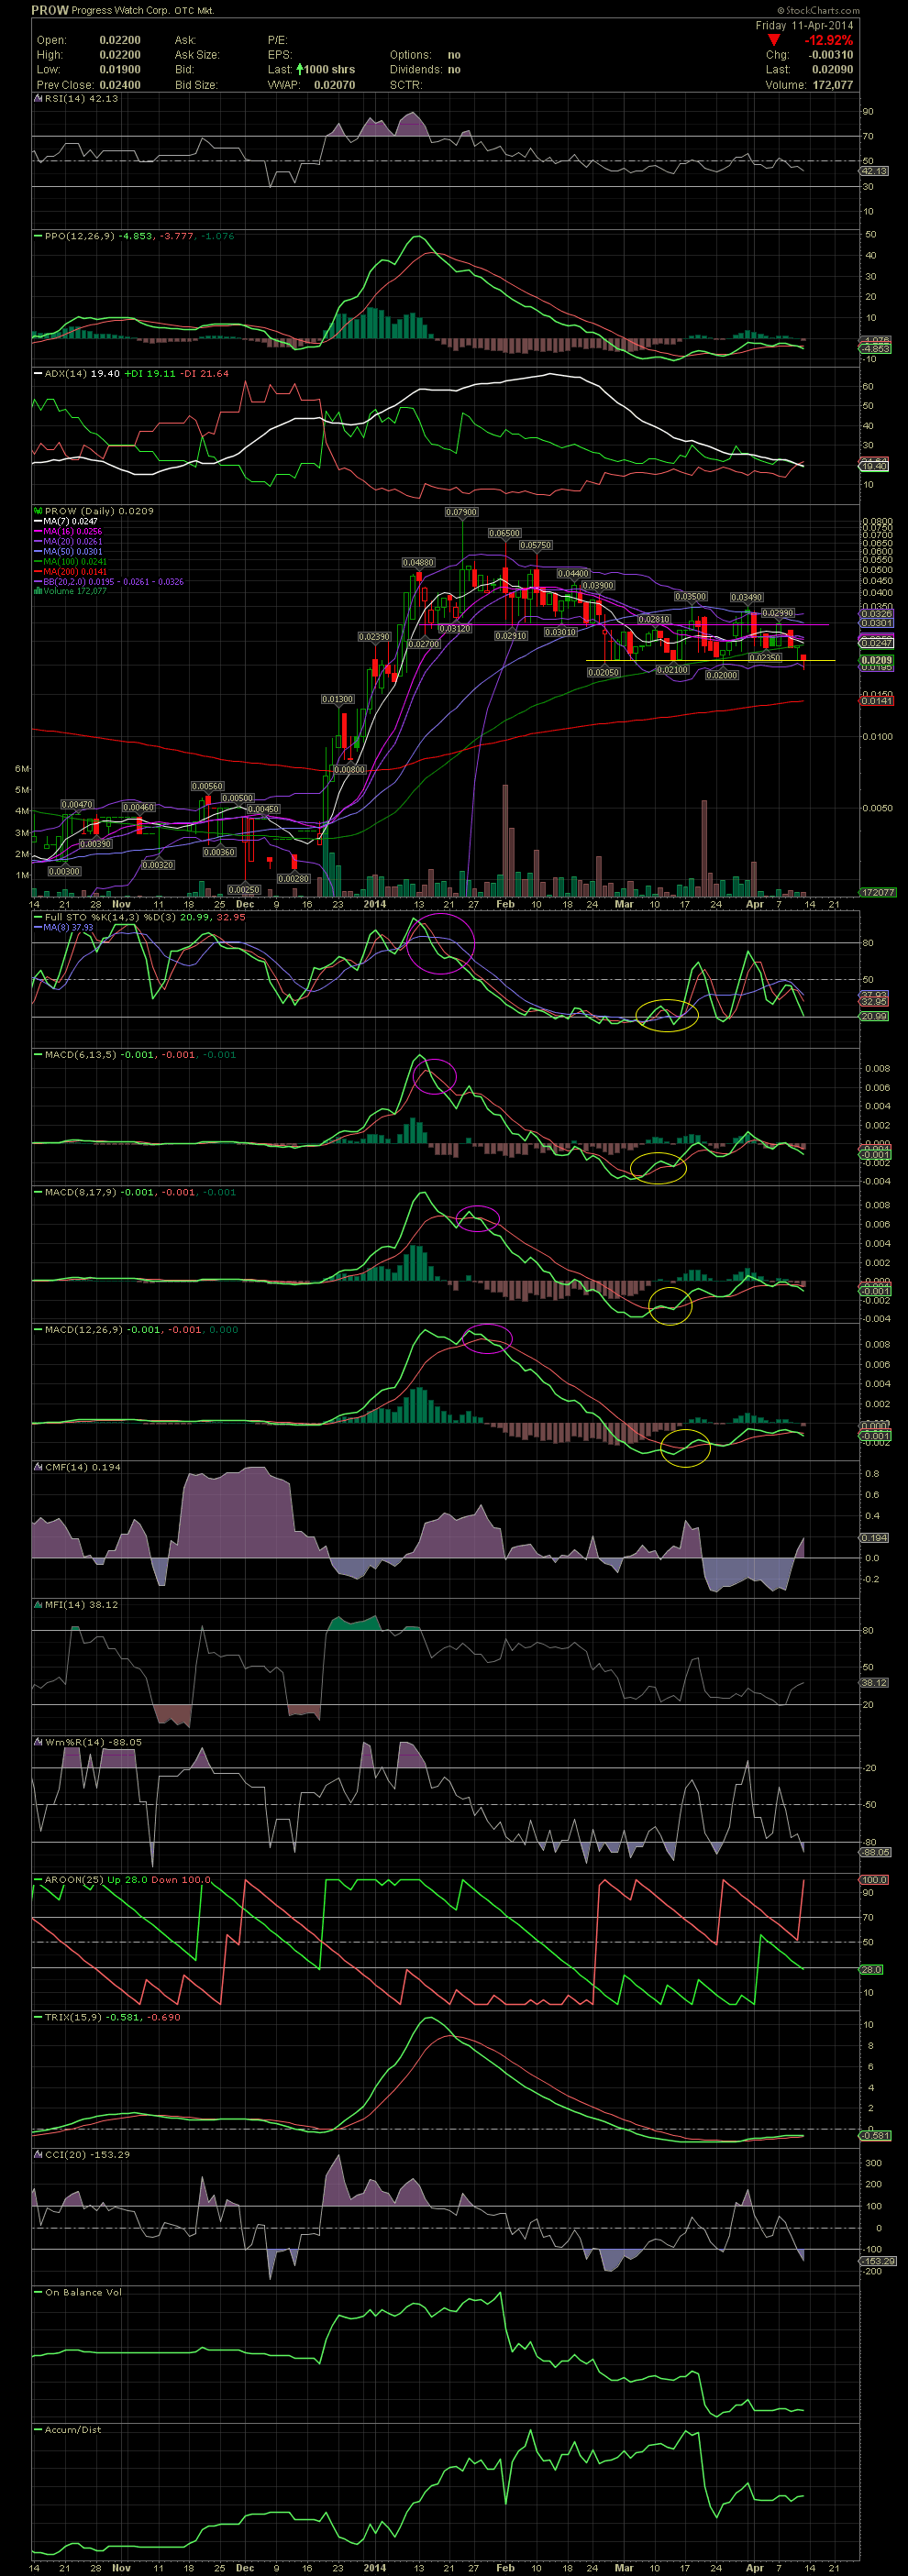
PNTV Daily Chart ~ A Failure at a Multiple Top
Post# of 2561
Unfortunately, PNTV couldn't break thru the high .04s/low .05s tops area which kept a lit on the share price for almost five weeks. The move outside the upper bollie to .06 when news hit three weeks ago was, in hindsight, a great area to sell a few or all of your shares. I wasn't holding too much at that time and chose to hold. Once again, when the FullSto and MACDs begin a negative crossover with a stock at a short term high, it's not a good idea to get greedy or begin to out-think a chart. Although the indicators aren't quite there yet, I do like the direction PNTV is headed (finally), so I began accumulating a larger position over the last few days. Had I listened to the chart, I'd be accumulating twice as many shares now with the price where it's at. Someone smack me upside the head when I do dumb moves like this, please! lol. Now we'll see if the MA200 can offer some support on this low volume selloff. Additionally, there are on going debt conversions underway. I'm not sure how much is left to go, but if rumors are correct, we are looking at another $40-$50k worth. That should be the end of an almost two year fiasco of toxic debt funding. All I can say is that things should never have gone in that direction, but it is what it is. The FullSto and MACDs are in oversold territory, but also have a ways to go before leveling out and curling. A few of us will be adding in the .02s this week and hoping we don't see .01s. Should that happen, we'll have to break the grandkids' piggy banks and really step it up. I don't see a lot of risk in PNTV, as the NOL should be worth .05 during any BK or sale of the company. So currently, I think the sold is undervalued, fwiw. GLTA

 (0)
(0) (0)
(0)