$LJPC Daily Chart ~ Beginning to Level Out After
Post# of 2561
Posted On: 03/30/2014 9:37:36 PM

$LJPC Daily Chart ~ Beginning to Level Out
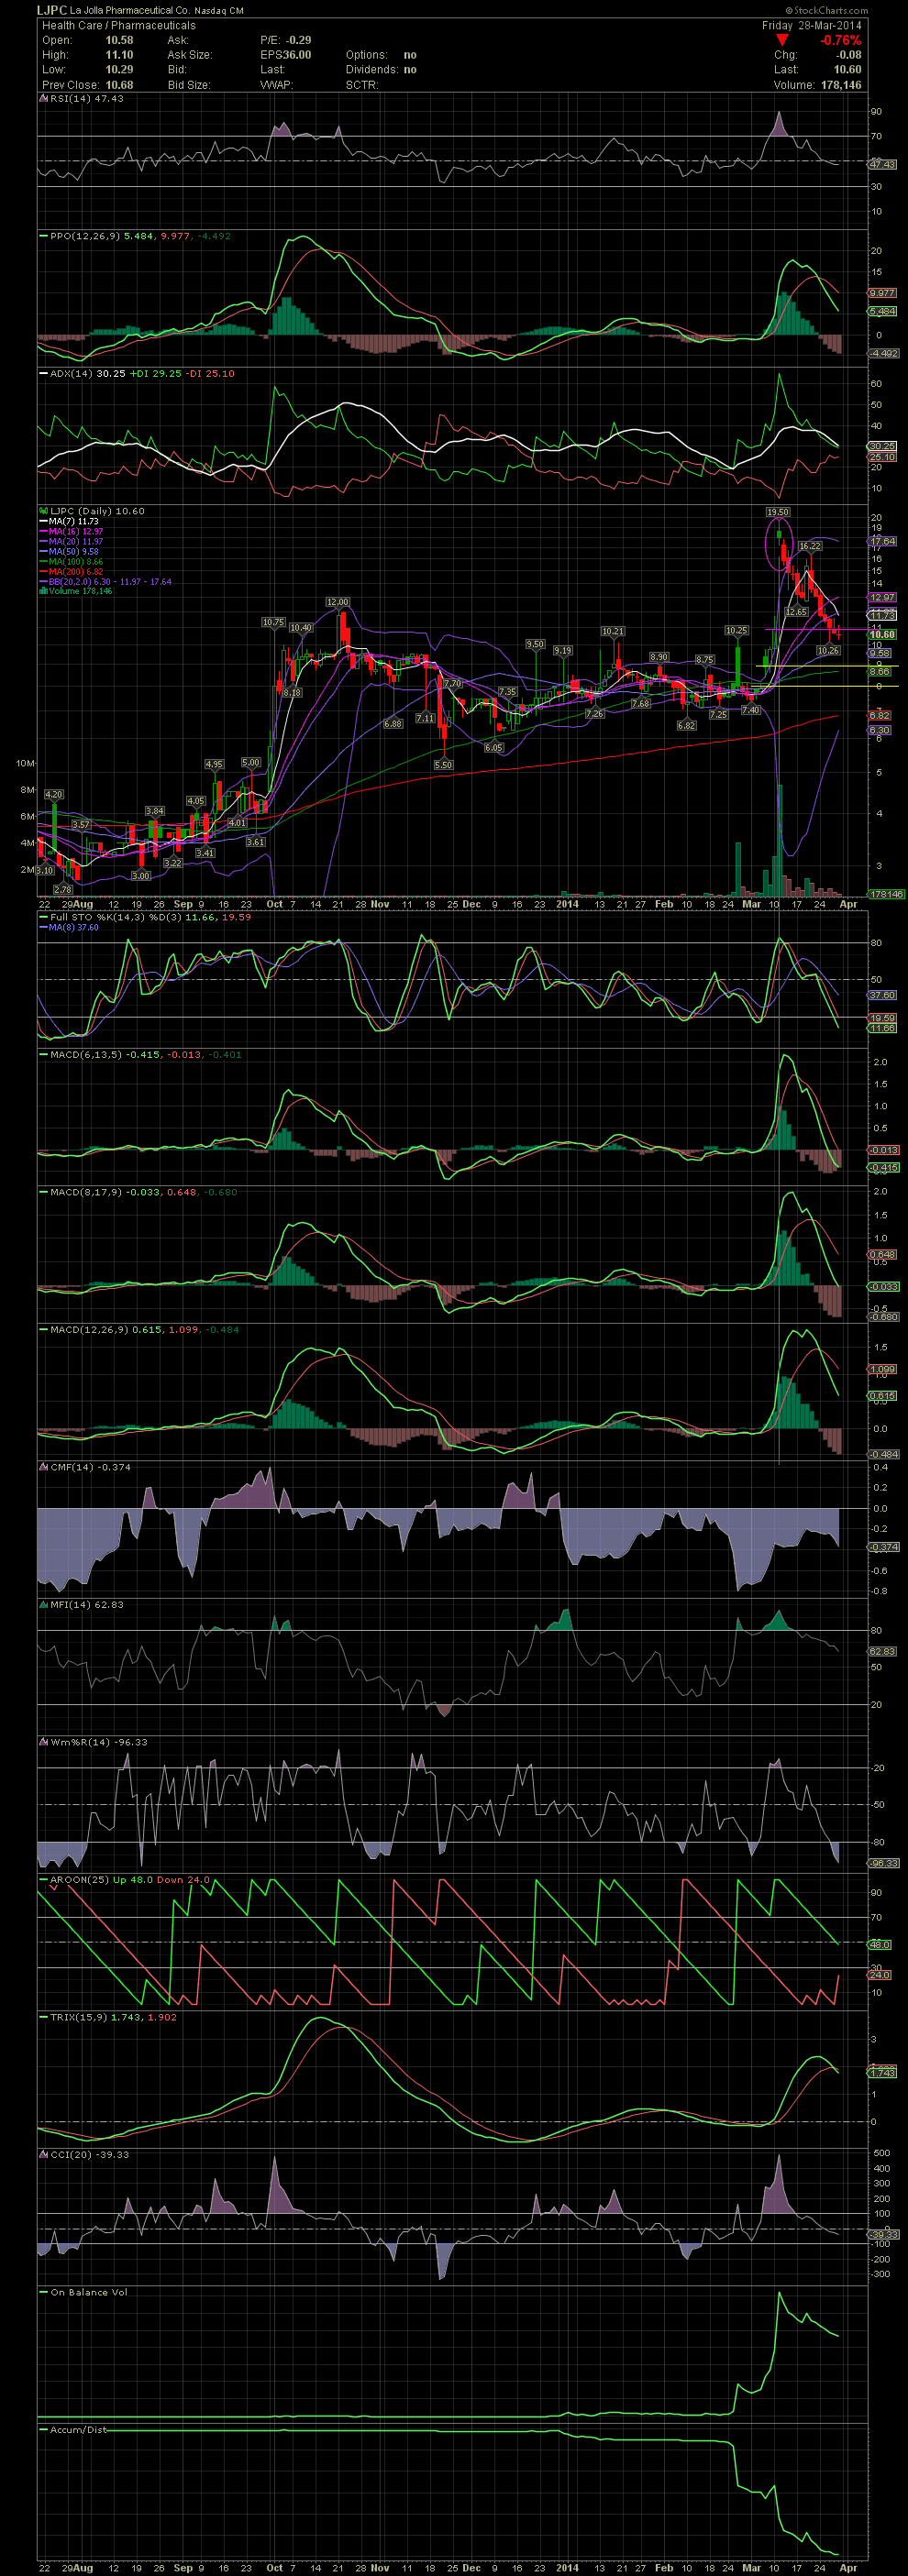
After filling the gap on Wed, LJPC has started to level off in the mid to high 10.00s. The FullSto and fast MACD have entered oversold territory with the other MACDs still diverging to the downside. I'm not sure if we'll see more downside or if a bottom is being established in the 10.00s. I received two questions regarding the 'outside the upper bollie' and the confirmations of the FullSto and MACDs with a 'negative crossover'. I notated, in pink, a vertical line when the stock traded way outside the upper bollie. To me, that move is almost always faster than the FullSto and MACDs since those indicators are based on more than just an hour or two of trading. In the case of our LJPC exits on the day the stock gapped and trapped many while opening outside the upper bollie, we sold well before the FullSto and MACDs crossed to the downside as you can see on the chart. It was just a common sense decision on that morning. Could the stock have moved higher? Of course. But with gains to lock in from the 7.30s to 9.05, the taking of profits, near 19.00 during a major gap, was a great move to lock in some green. I have also notated another gap (yellow channel lines) which may or not get filled. But should the MA50 at 958 not hold as support, it would certainly become a realistic target. I don't expect the stock to see the MA50 nor the gap fill, but for now we'll wait to see when a bottom has been put in. A number of brokerage firms are still maintaining price targets of $27 to $32. In the meantime, we'll swing trade our positions when the chart allows us calculated entries and exits along the way. GLTA
After filling the gap on Wed, LJPC has started to level off in the mid to high 10.00s. The FullSto and fast MACD have entered oversold territory with the other MACDs still diverging to the downside. I'm not sure if we'll see more downside or if a bottom is being established in the 10.00s. I received two questions regarding the 'outside the upper bollie' and the confirmations of the FullSto and MACDs with a 'negative crossover'. I notated, in pink, a vertical line when the stock traded way outside the upper bollie. To me, that move is almost always faster than the FullSto and MACDs since those indicators are based on more than just an hour or two of trading. In the case of our LJPC exits on the day the stock gapped and trapped many while opening outside the upper bollie, we sold well before the FullSto and MACDs crossed to the downside as you can see on the chart. It was just a common sense decision on that morning. Could the stock have moved higher? Of course. But with gains to lock in from the 7.30s to 9.05, the taking of profits, near 19.00 during a major gap, was a great move to lock in some green. I have also notated another gap (yellow channel lines) which may or not get filled. But should the MA50 at 958 not hold as support, it would certainly become a realistic target. I don't expect the stock to see the MA50 nor the gap fill, but for now we'll wait to see when a bottom has been put in. A number of brokerage firms are still maintaining price targets of $27 to $32. In the meantime, we'll swing trade our positions when the chart allows us calculated entries and exits along the way. GLTA
 (0)
(0) (0)
(0)