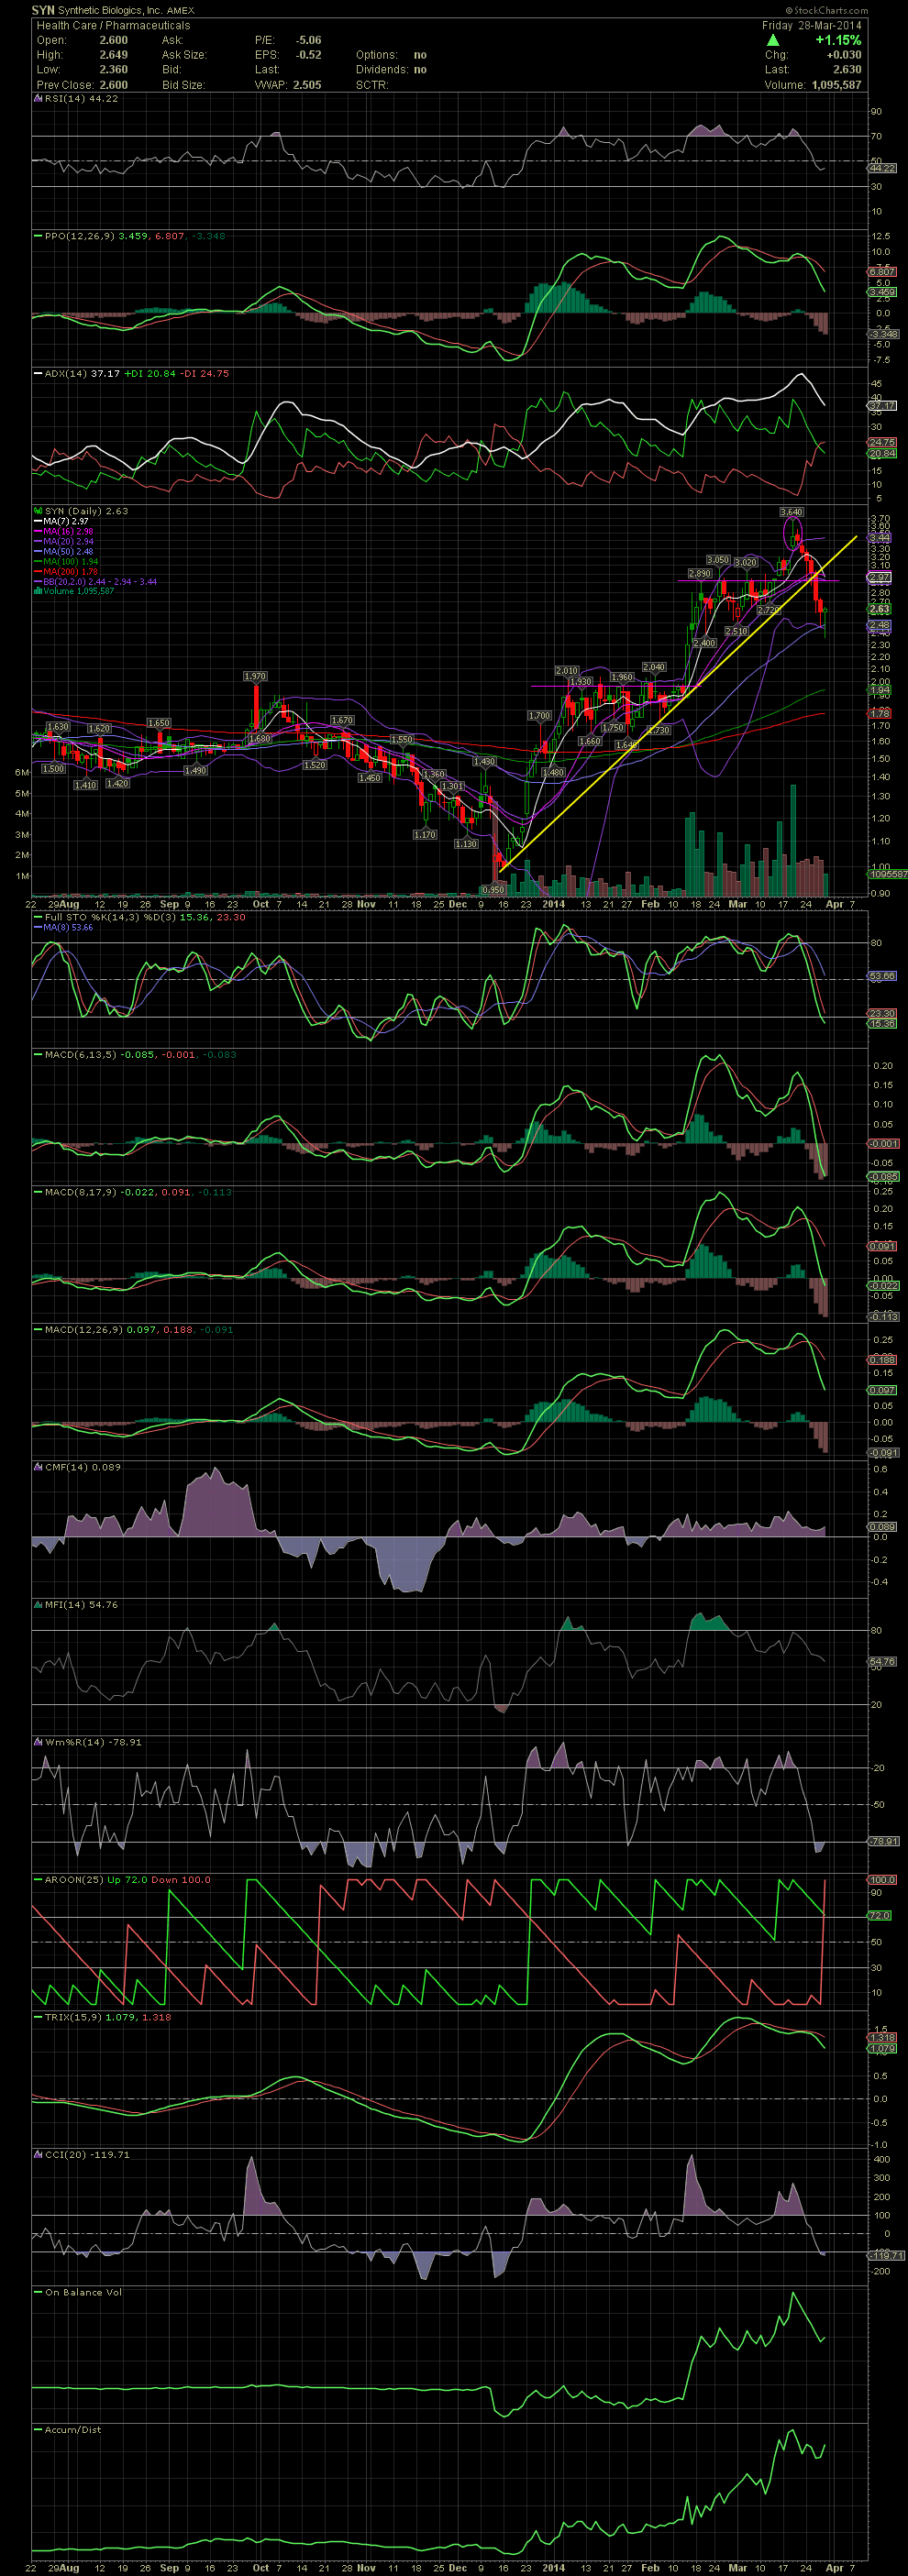
$SYN Daily Chart ~ Down $1.00 Since Our Exits Less
Post# of 2561

The sell outside the upper bollie, as usual, was the thing to do. Since the 3.30s to 3.60s, SYN has fallen sharply into the mid 2.50s. The FullSto and MACDs were in very lofty levels, so the stock really only had one way to go, into a correction mode. There is some minor support possible in the 2.40 area of mid Feb when the volume expanded dramatically from previous levels. The MA50 is also sitting at 2.48and rising. If this level doesn't hold, I would look for the previous tops line (pink) established in Jan in the high 1.90s to 2.04s. I liked Friday's hammer and reversal off the 2.36 intraday low. Barring any strong material news, SYN could continue to fall. On watch for now. GLTA

 (0)
(0) (0)
(0)