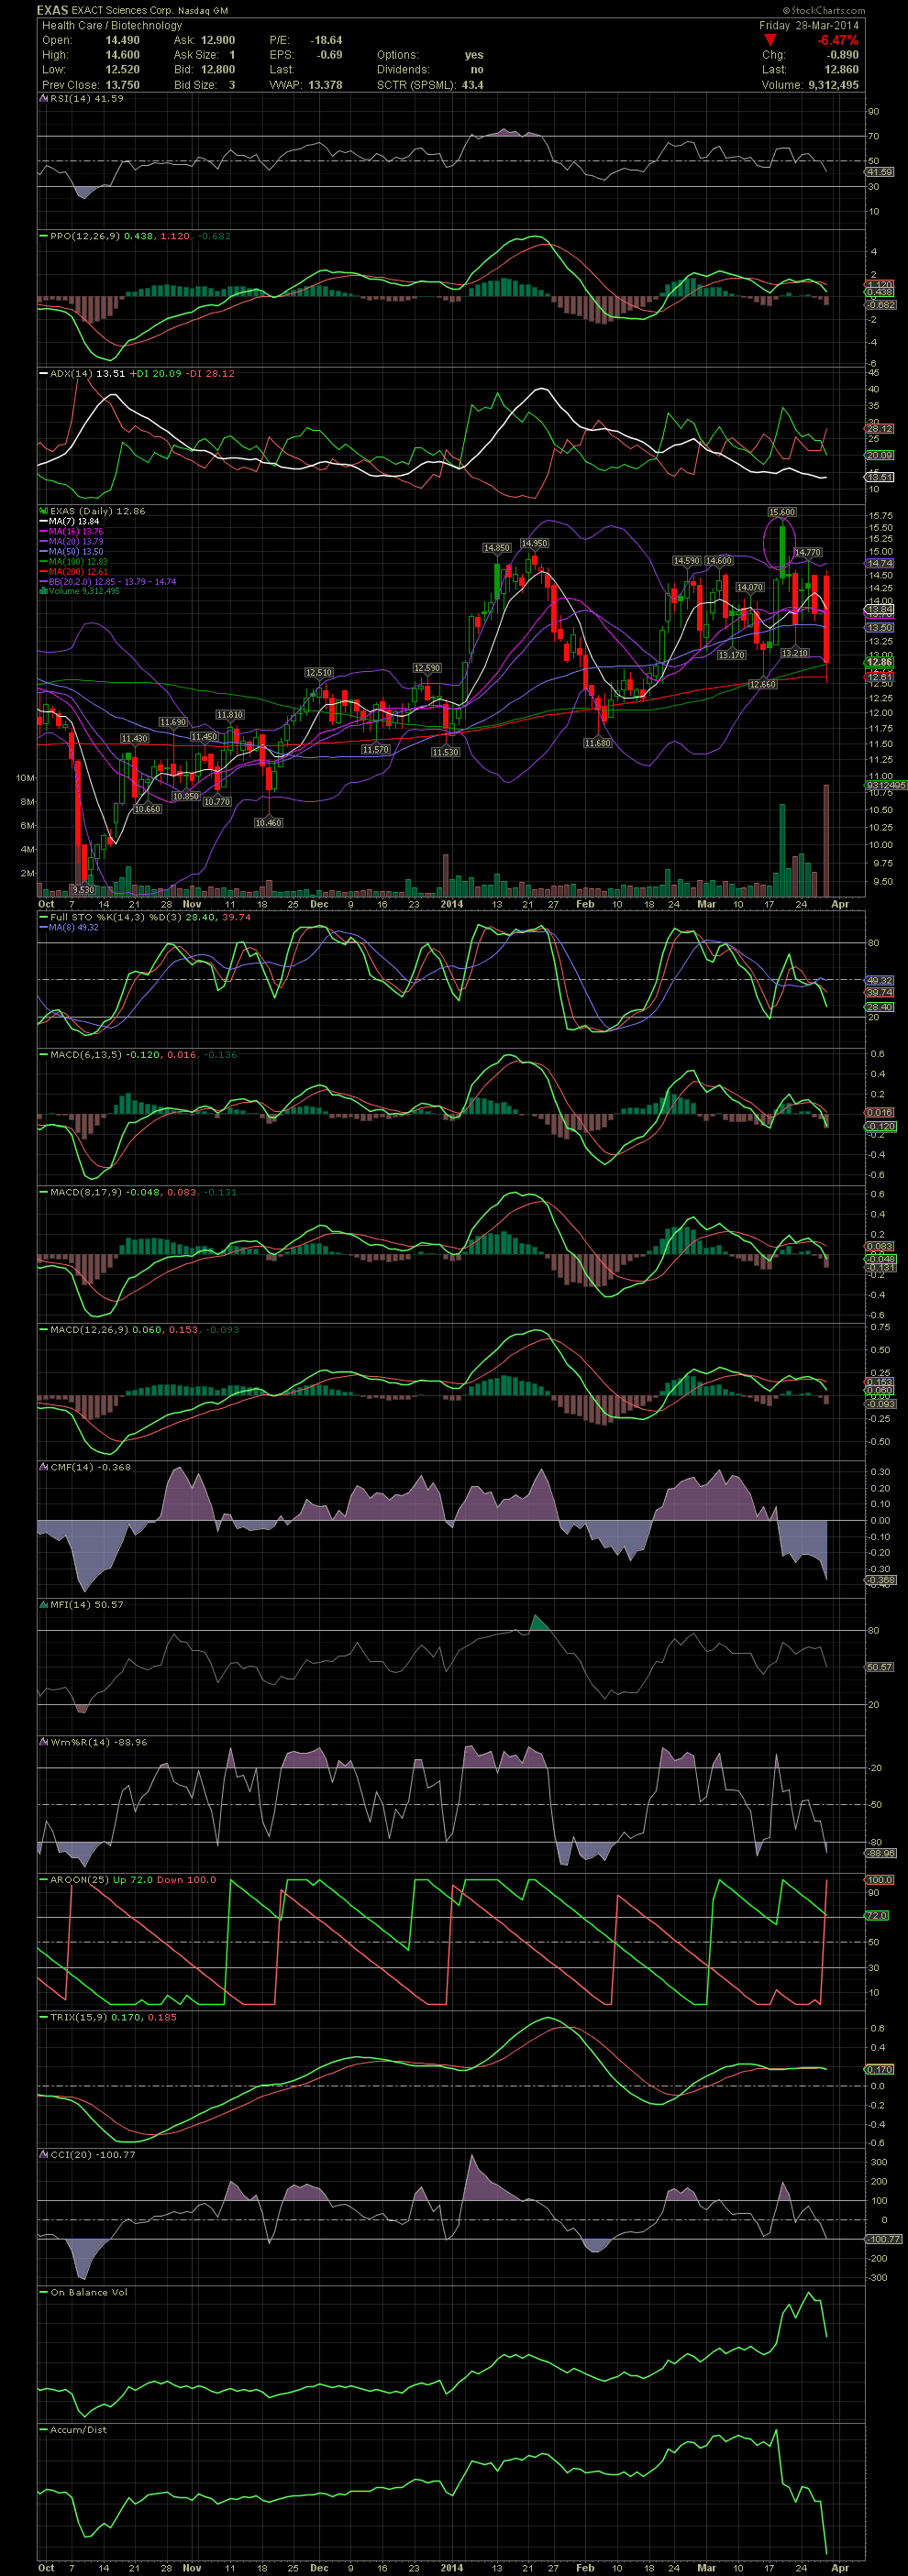
$EXAS Daily Chart ~ Huge Volume Selloff on Friday
Post# of 2561
For those of you following along and learning technicals and charting, it might be useful if you link back to March 23 (the post I'm responding to) for a read on EXAS the I posted. I have not yet entered and am still waiting for the FullSto and MACDs to reset although the stock did fall to the 12.59 (MA200 on Mar 23) that I mentioned. If the stock doesn't bounce off the MA200, I would expect to see a selloff to the previous lows in the mid 11.00s, which were seen in Dec, Jan and Feb. Imagine being one of the many who chased the stock outside the upper bollie as high as 15.60 just eight days ago. Happens all the time with the gap and traps. Watching. GLTA

 (0)
(0) (0)
(0)