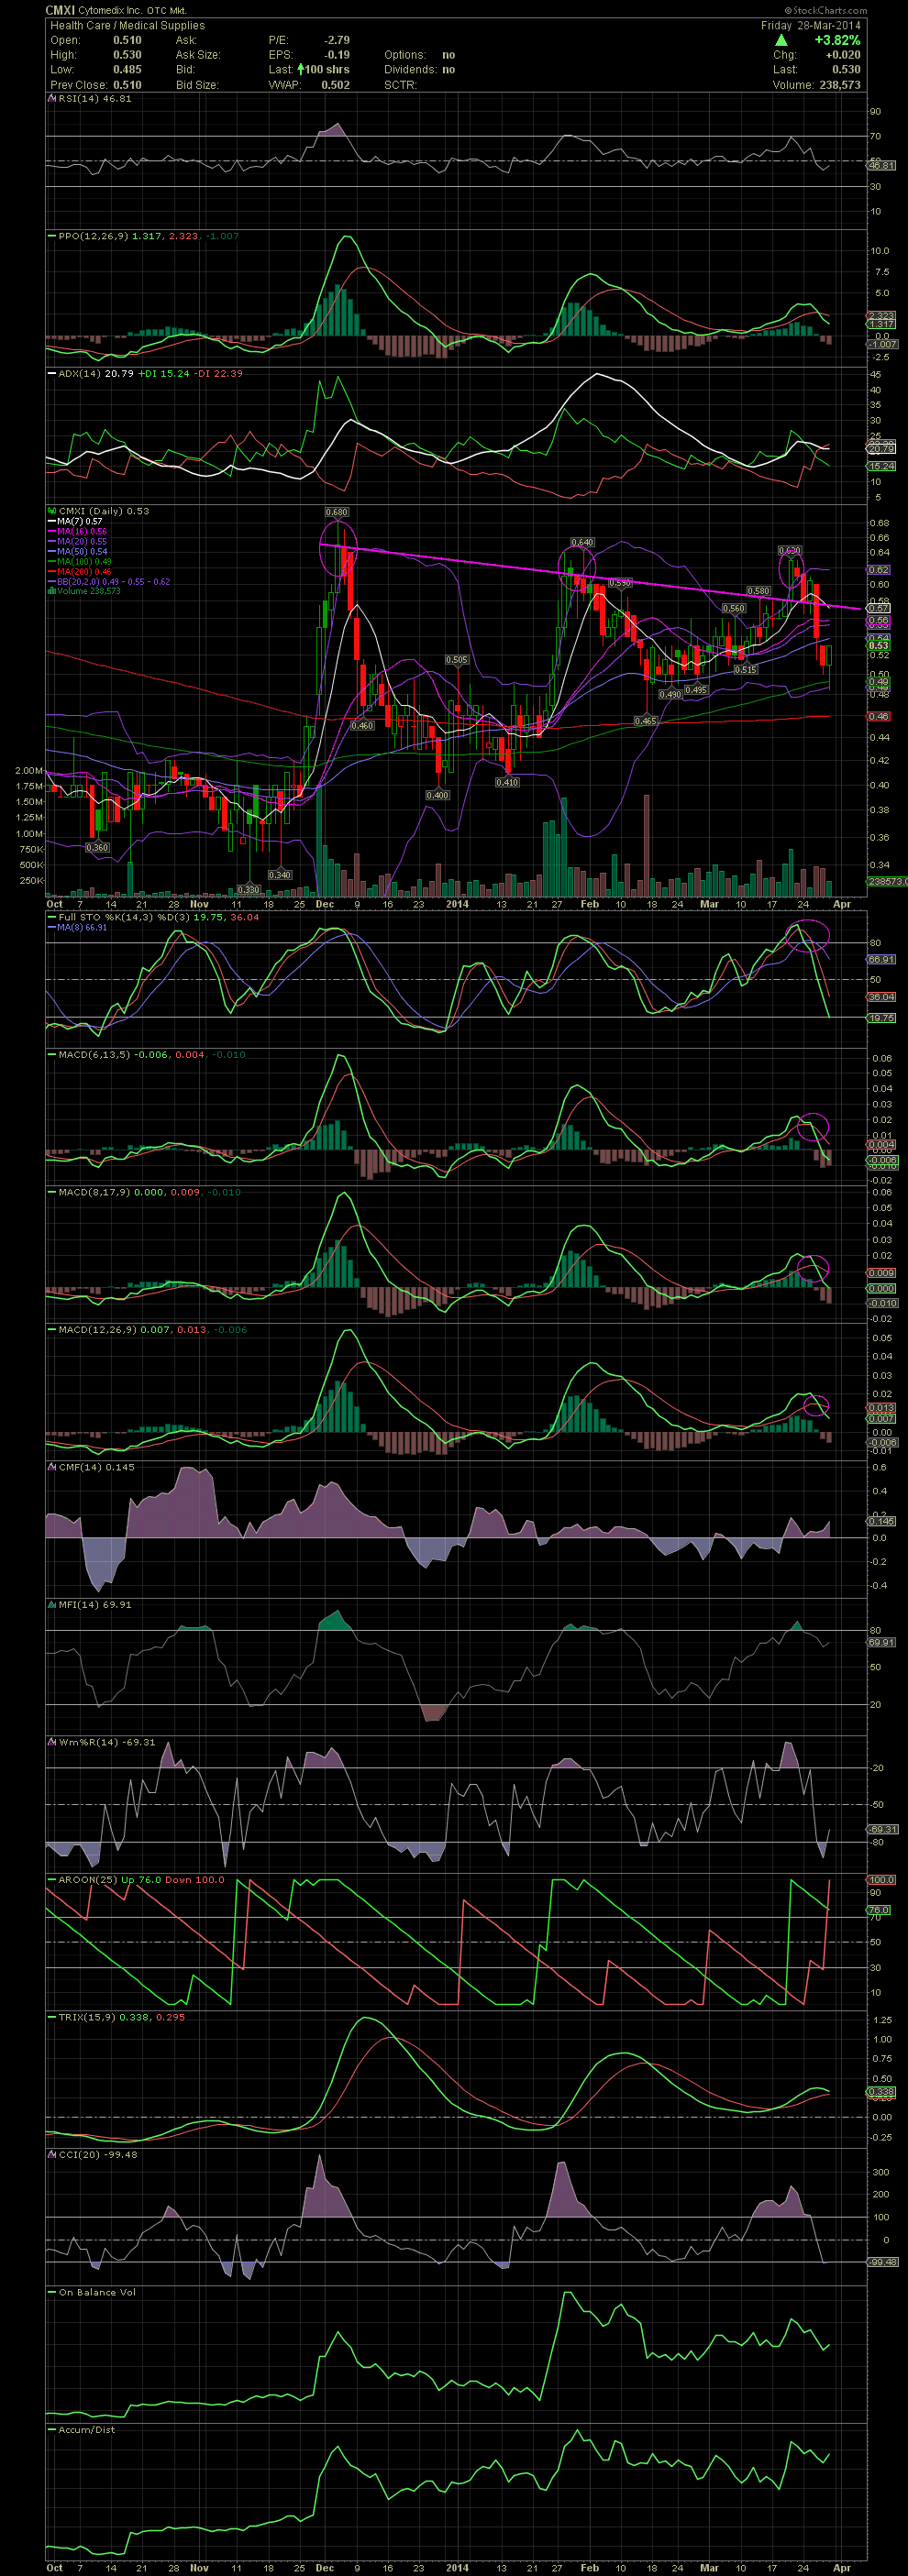
$CMXI Daily Chart ~ Sharp Selloff After Reversals
Post# of 2561
I sold the balance of my CMXI after a sharp reversal from my last update. Whereas the FullSto and MACDs were looking good a couple of days prior, the weakness in the sector did take down CMXI from the .60s to the high .48s. It doesn't look like a lot, but it was a drop of almost 20% from high to low. My sell at .58 was from entries in the high .40s. Not the best trades ever, but green is green. Collectively for all the CMXI swings trades, the average was 17% in Jan and again in Mar. As to the current technicals, as you can see on the chart below, CMXI sold off from the upper bollie down to the lower bollie in addition to testing the MA100. Keep your eyes on the FullSto and MACDs for when their declines begin to level out. Support in mid February was at .49/.50, so a calculated accumulation phase could begin at previous support levels. Most all of the bios/pharmas are being sold off during the rotational shift of funds by the large fund managers into other sectors. There are going to be some great buys shortly in this sector. So stay on top of things and get ready. GLTA
| 03/24/14 | Sold | 5,000 of CMXI @ $0.57 (Order #897) | 2,841.94 |

 (0)
(0) (0)
(0)