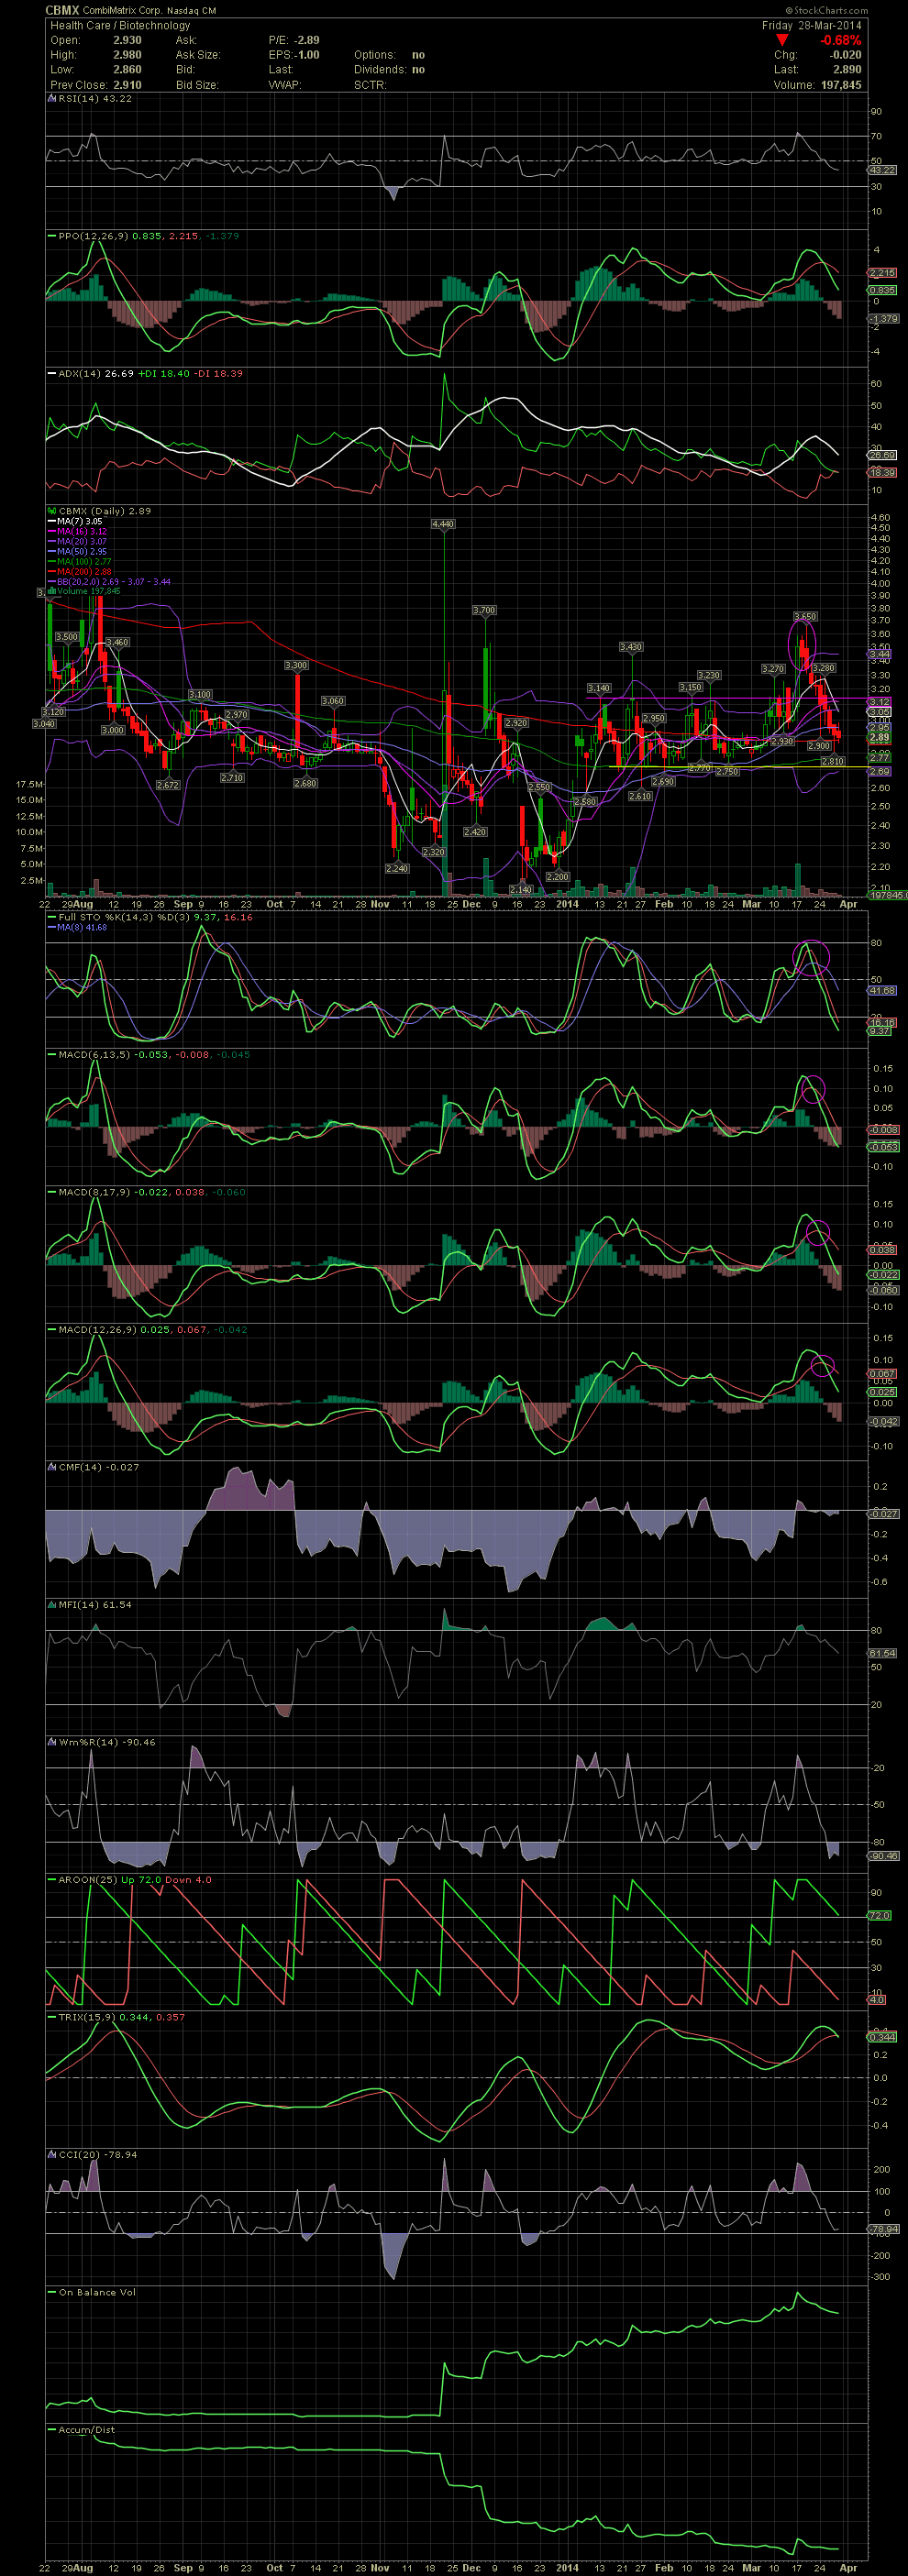
$CBMX Daily Chart ~ Nine Consecutive Red Days Sinc
Post# of 2561
Our exits outside the upper bollies from $3.48 into the $3.60s was the correct move. As always, we'll never know how far a stock might return to within the bollie. It could happen when the share price stalls and the bollie band catches up, it might occur with a gradual, slight decline back within, or it could reenter with a severe drop as we've seen with CBMX. Since our sells, CBMX has broken through most support levels to include the shorter term moving averages. The stock is currently attempting to find support at the MA200. The FullSto and MACDs, which confirmed a sell signal days after the stock traded to far outside the upper bollies, are continuing their divergence to the downside. The FullSto is entering oversold territory while the MACDs have more downside ahead. Should the MA200 fail as support, CBMX will more than likely see the MA100 at $2.77 and possibly the horizontal support line at $2.70. With the entire biotech/pharma sector under pressure, I'm in no rush to attempt catching falling knives. On watch for now. GLTA

 (0)
(0) (0)
(0)