
SYN Daily Chart ~ A Return to Within the Bollies
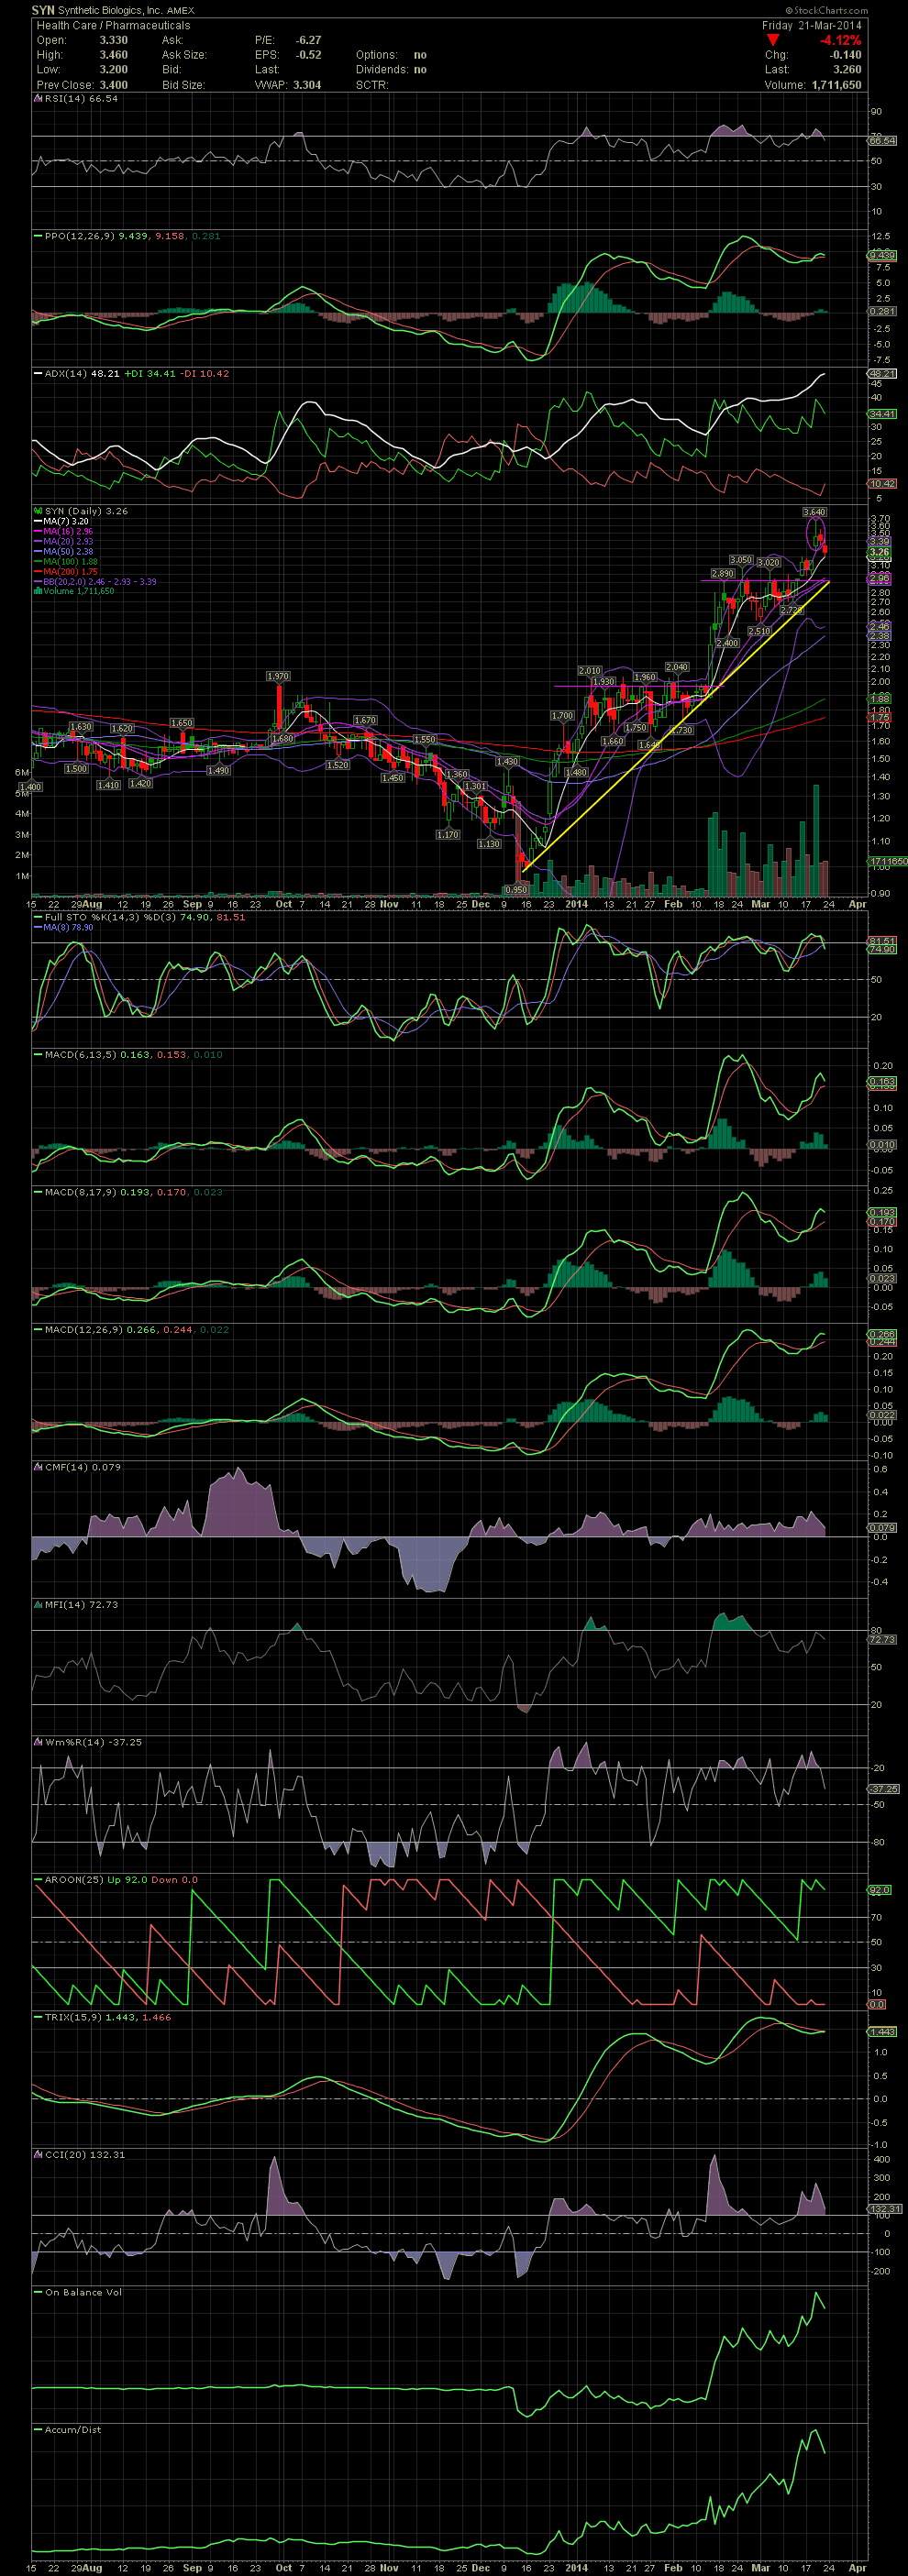
On Wednesday and Thursday, SYN shot outside the upper bollie (I'll bet a few of you are beginning to get tired of the upper bollie mentions, lol), so I sold everything from the 3.37 to as high as 3.51. Four friends, whom I spoke with this morning, did the same. One remains in the stock. Our entries ranged from the 2.70s to 3.03. So the sells results in gains of 15.8% to 27.6% over 4 days to 8 days. Once again, nice trading guys! As to the chart now, SYN has returned to within the bollies. But with the FullSto and MACDs curling a little towards the downside, I will wait a few days to see what happens. If SYN follows a number of biotech stocks, a decline to its previous horizontal resistance could happen over the next week. That would take the stock back to the 2.95 level. We'll watch for now. GLTA
On Wednesday and Thursday, SYN shot outside the upper bollie (I'll bet a few of you are beginning to get tired of the upper bollie mentions, lol), so I sold everything from the 3.37 to as high as 3.51. Four friends, whom I spoke with this morning, did the same. One remains in the stock. Our entries ranged from the 2.70s to 3.03. So the sells results in gains of 15.8% to 27.6% over 4 days to 8 days. Once again, nice trading guys! As to the chart now, SYN has returned to within the bollies. But with the FullSto and MACDs curling a little towards the downside, I will wait a few days to see what happens. If SYN follows a number of biotech stocks, a decline to its previous horizontal resistance could happen over the next week. That would take the stock back to the 2.95 level. We'll watch for now. GLTA
|
|||||||||||||||||||||||||||||||||