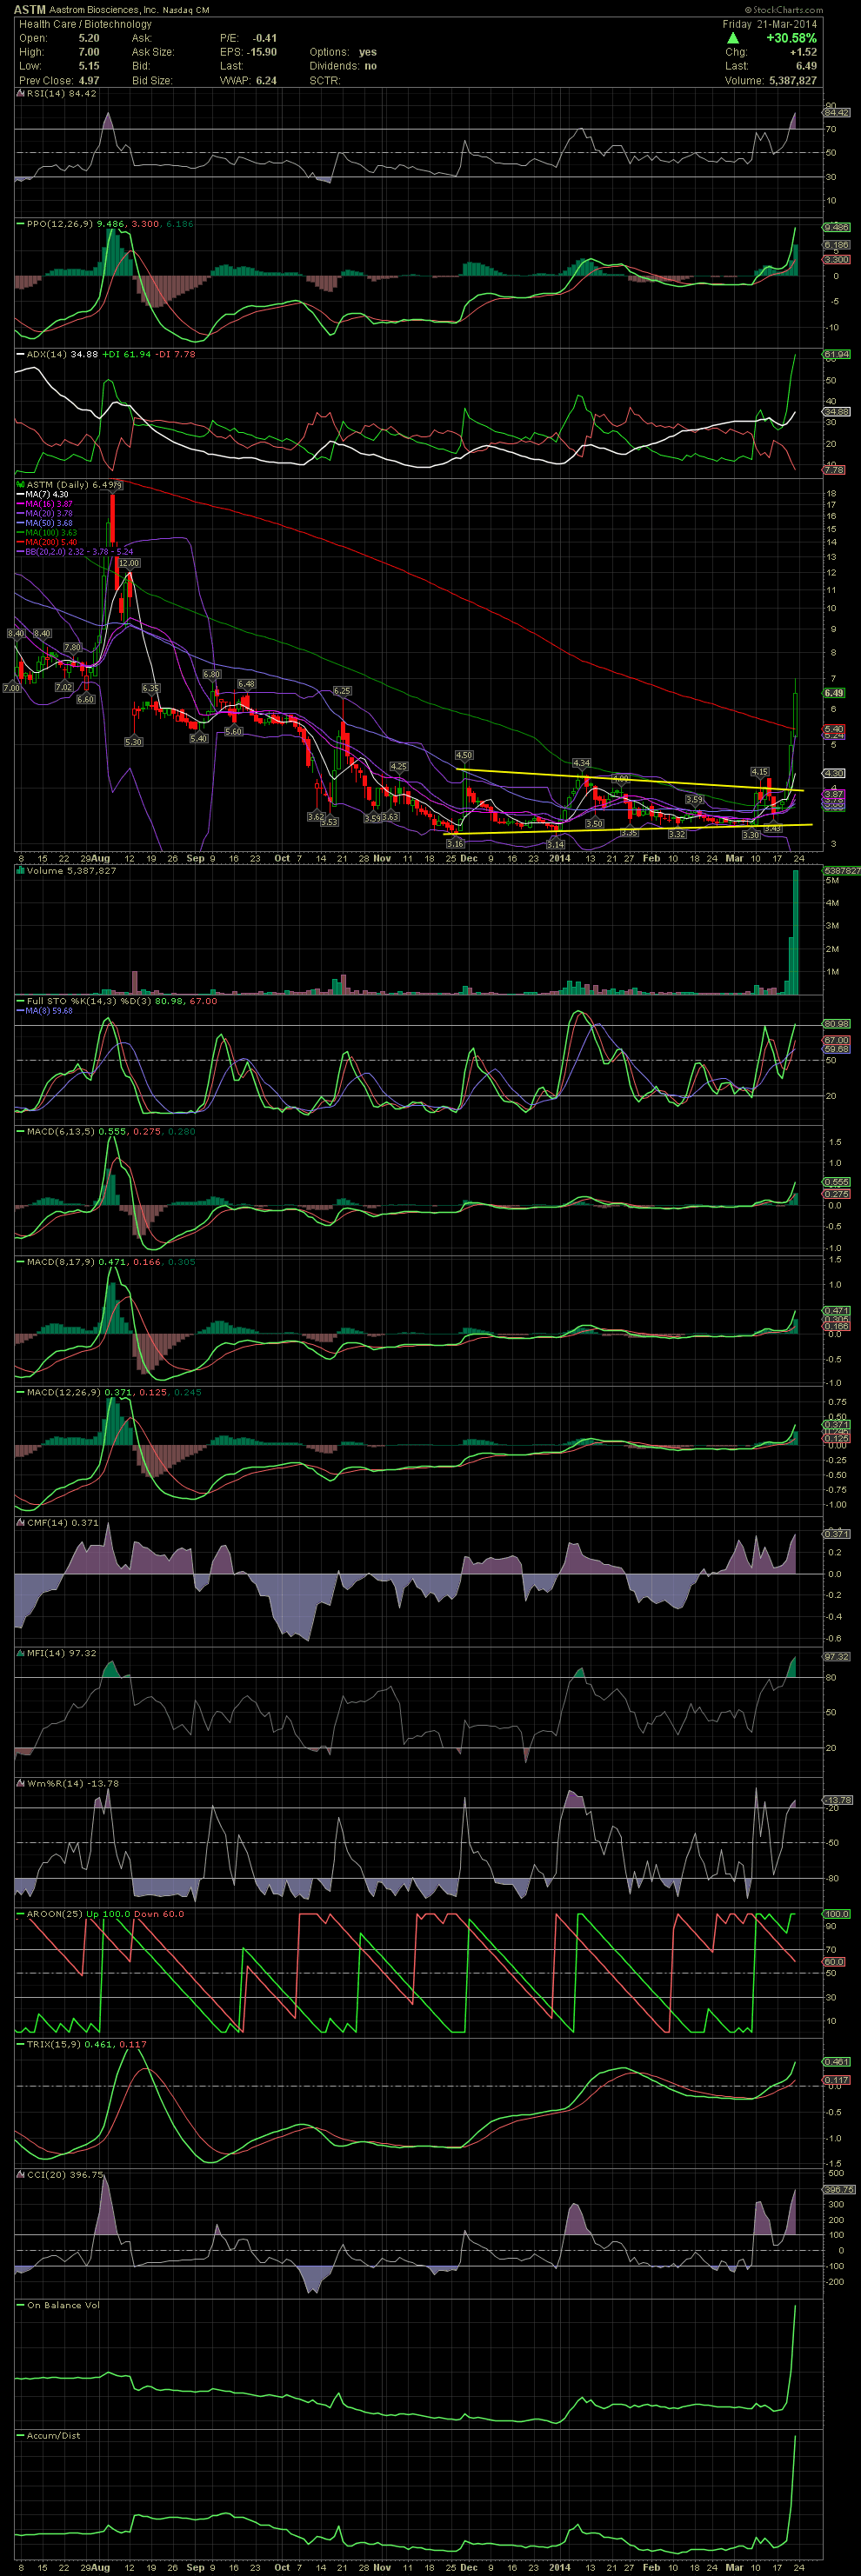
ASTM Daily Chart ~ A Huge Breakout I posted a ch
Post# of 2561
I posted a chart on ASTM on March 20 after the stock broke above the declining tops line. Those who I knew were in the stock, all took profits that day. Nice gains of as much as 60%. Another friend of mine, whom I didn't know was in the stock, decided to hold since the stock was only outside the upper bollie by a small amount. It will be interesting what he does now, because on Friday the stock jumped another 30% and is now completely outside the bollie band. The break over the MA200 was on huge volume. Another important level to watch is the 6.50 level, which was surpassed intraday on Friday. That 6.50 level is important if one looks back at the Aug and Sept periods. There's a large gap to fill on the upside to the low 10.00 area. Friday's large volume also appears to be some short covering (legal shorting). So to my friend Gary, nicely done my friend. You are almost up 100% over the last three weeks. Not bad for a big board stock! GLTA

 (0)
(0) (0)
(0)