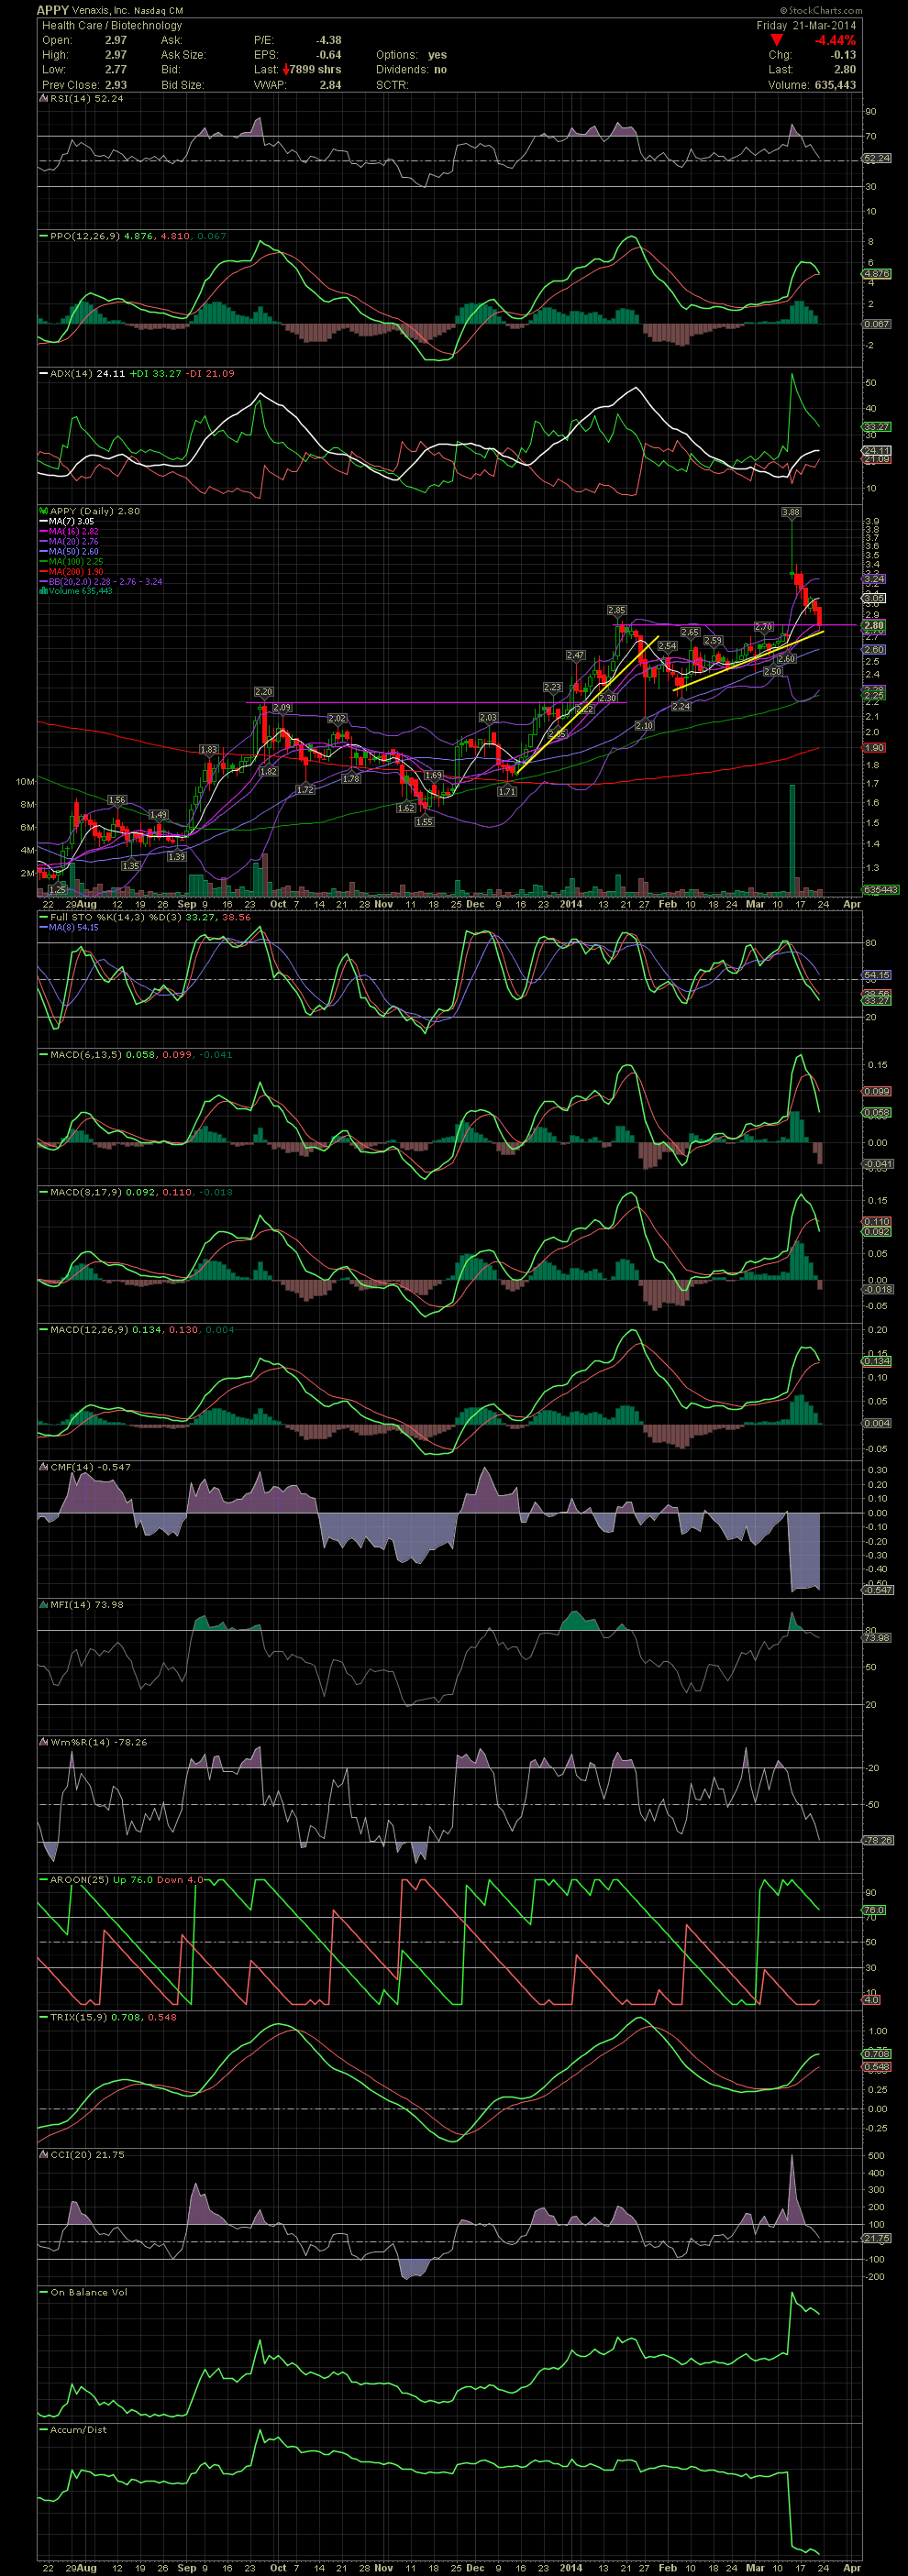
APPY Daily Chart ~ The Selloff Continues Our exi
Post# of 2561
Our exits from APPY between 3.22 and 3.80s, was the correct move. APPY popped to as high as 3.88 but the entire candle from the opening to the close was outside the upper bollie. Once again, following the simple plan of taking some or all off resulted in big gains for those of us that swing traded APPY. Since those sells, APPY has fallen to as low as 2.77. I re-entered with 3,000 shares on Friday when the stock got close to the support line (previously a horizontal resistance line) at 2.81. I'm in from 2.84 down to 2.81. I'm taking a calculated risk on these initial buys as the FullSto and MACDs are showing more downside is ahead. There are a number of catalysts that could reverse the trend very quickly. Should the stock break under the support line, I'm hoping it can find support on the short term rising support line (yellow) just below. Also below is the MA50 at 2.60. It's offered support for many months with the exception of a short period in November. If I'm wrong here at the 2.80 level, I'll probably be adding at the 2.60 level should the stock get there. GLTA

 (0)
(0) (0)
(0)