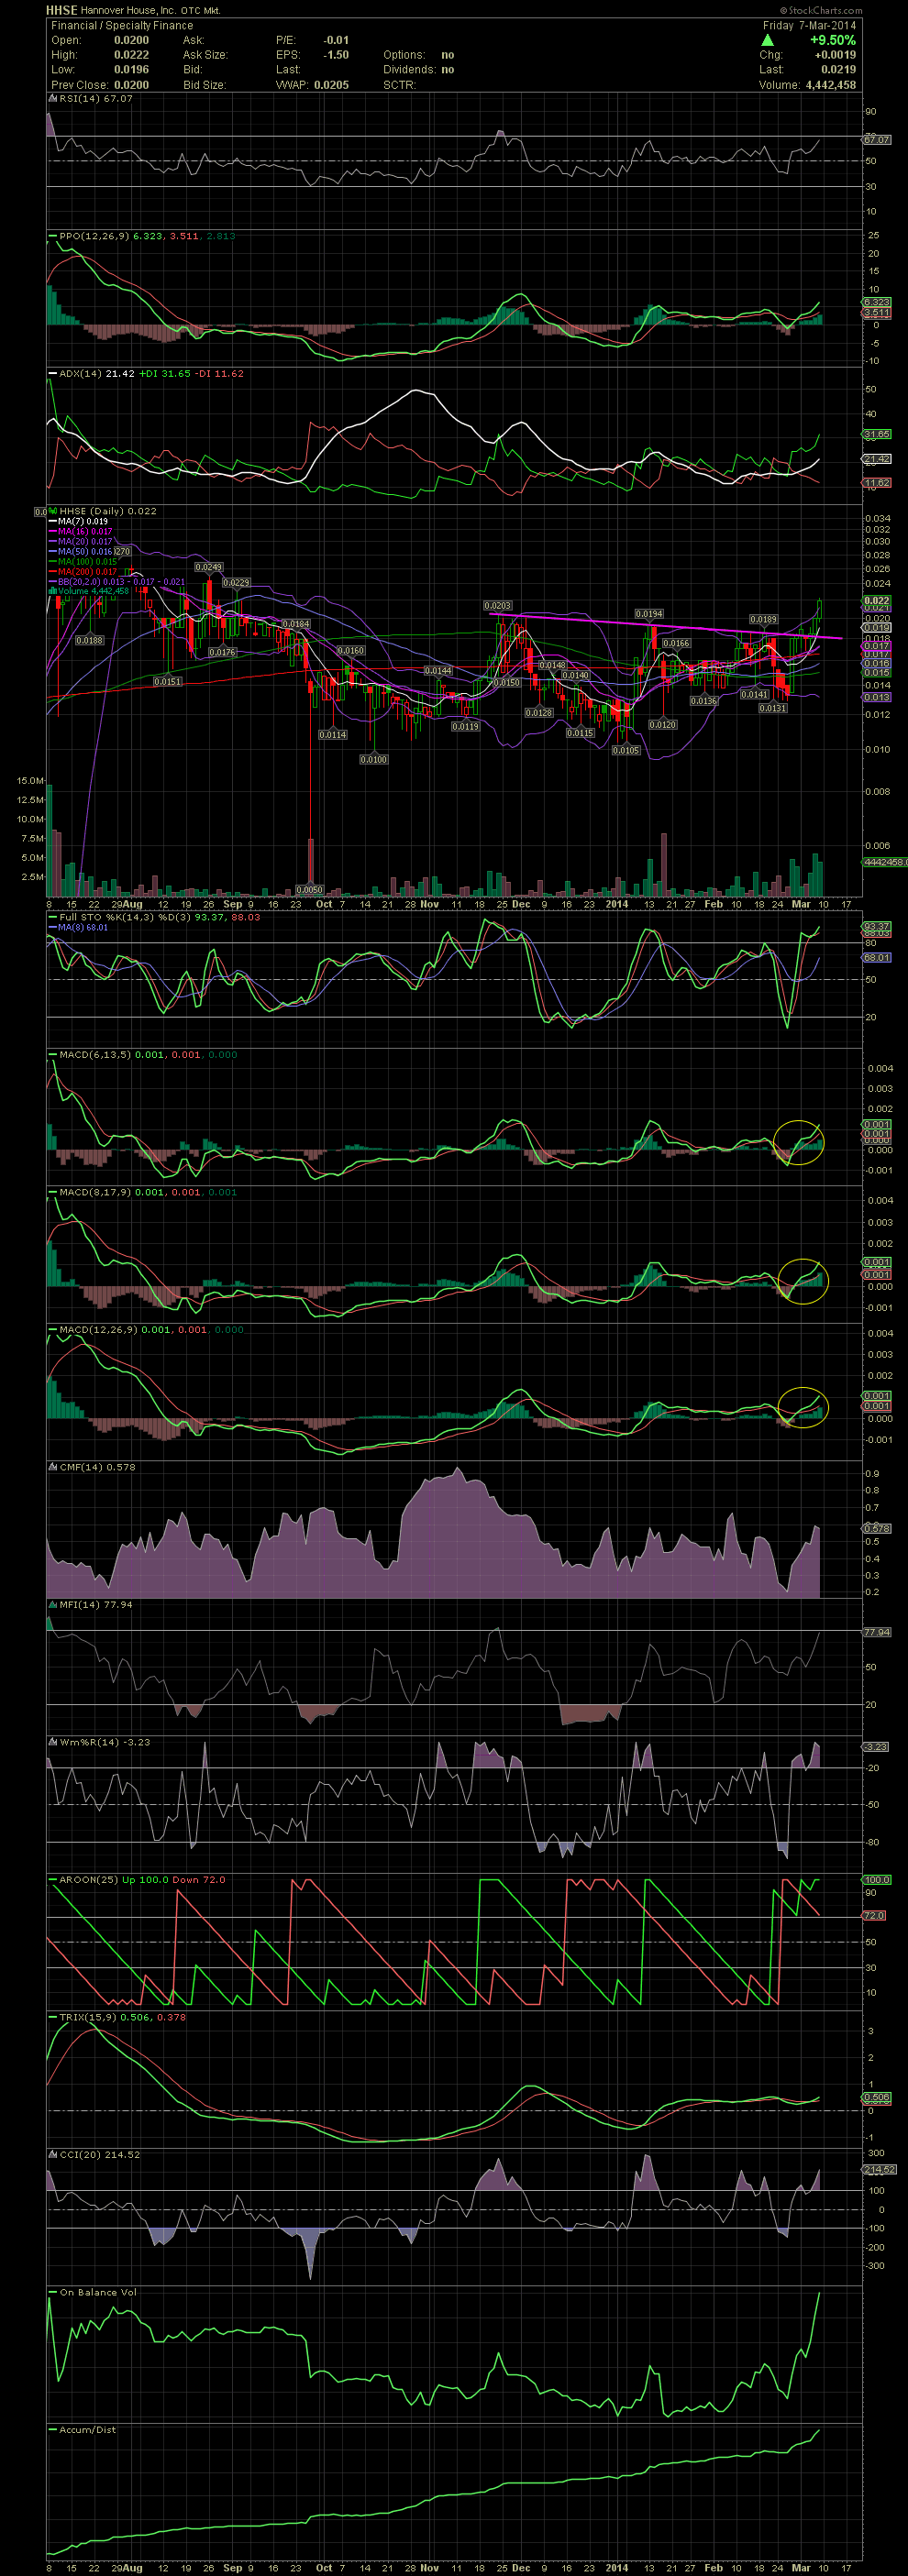
HHSE Daily Chart ~ Breaking Above the Declining To
Post# of 2561
HHSE began a move above the multi month declining tops line this last week. Link back to Feb 28 for my opinions, chart and entries at .017/.018. I'm looking for a move to .025+ which would be the highest in nine months. The rising volume bars suggest a move higher is imminent. The MACDs crossed over to the buy side last week and are beginning to strongly diverge. A close above .025, when looking at the weekly chart, shows that the next resistance levels are at .03 to .045. I'll be adding on any dips to the .018 level but hoping I don't get that opportunity, lol. GLTA

 (0)
(0) (0)
(0)