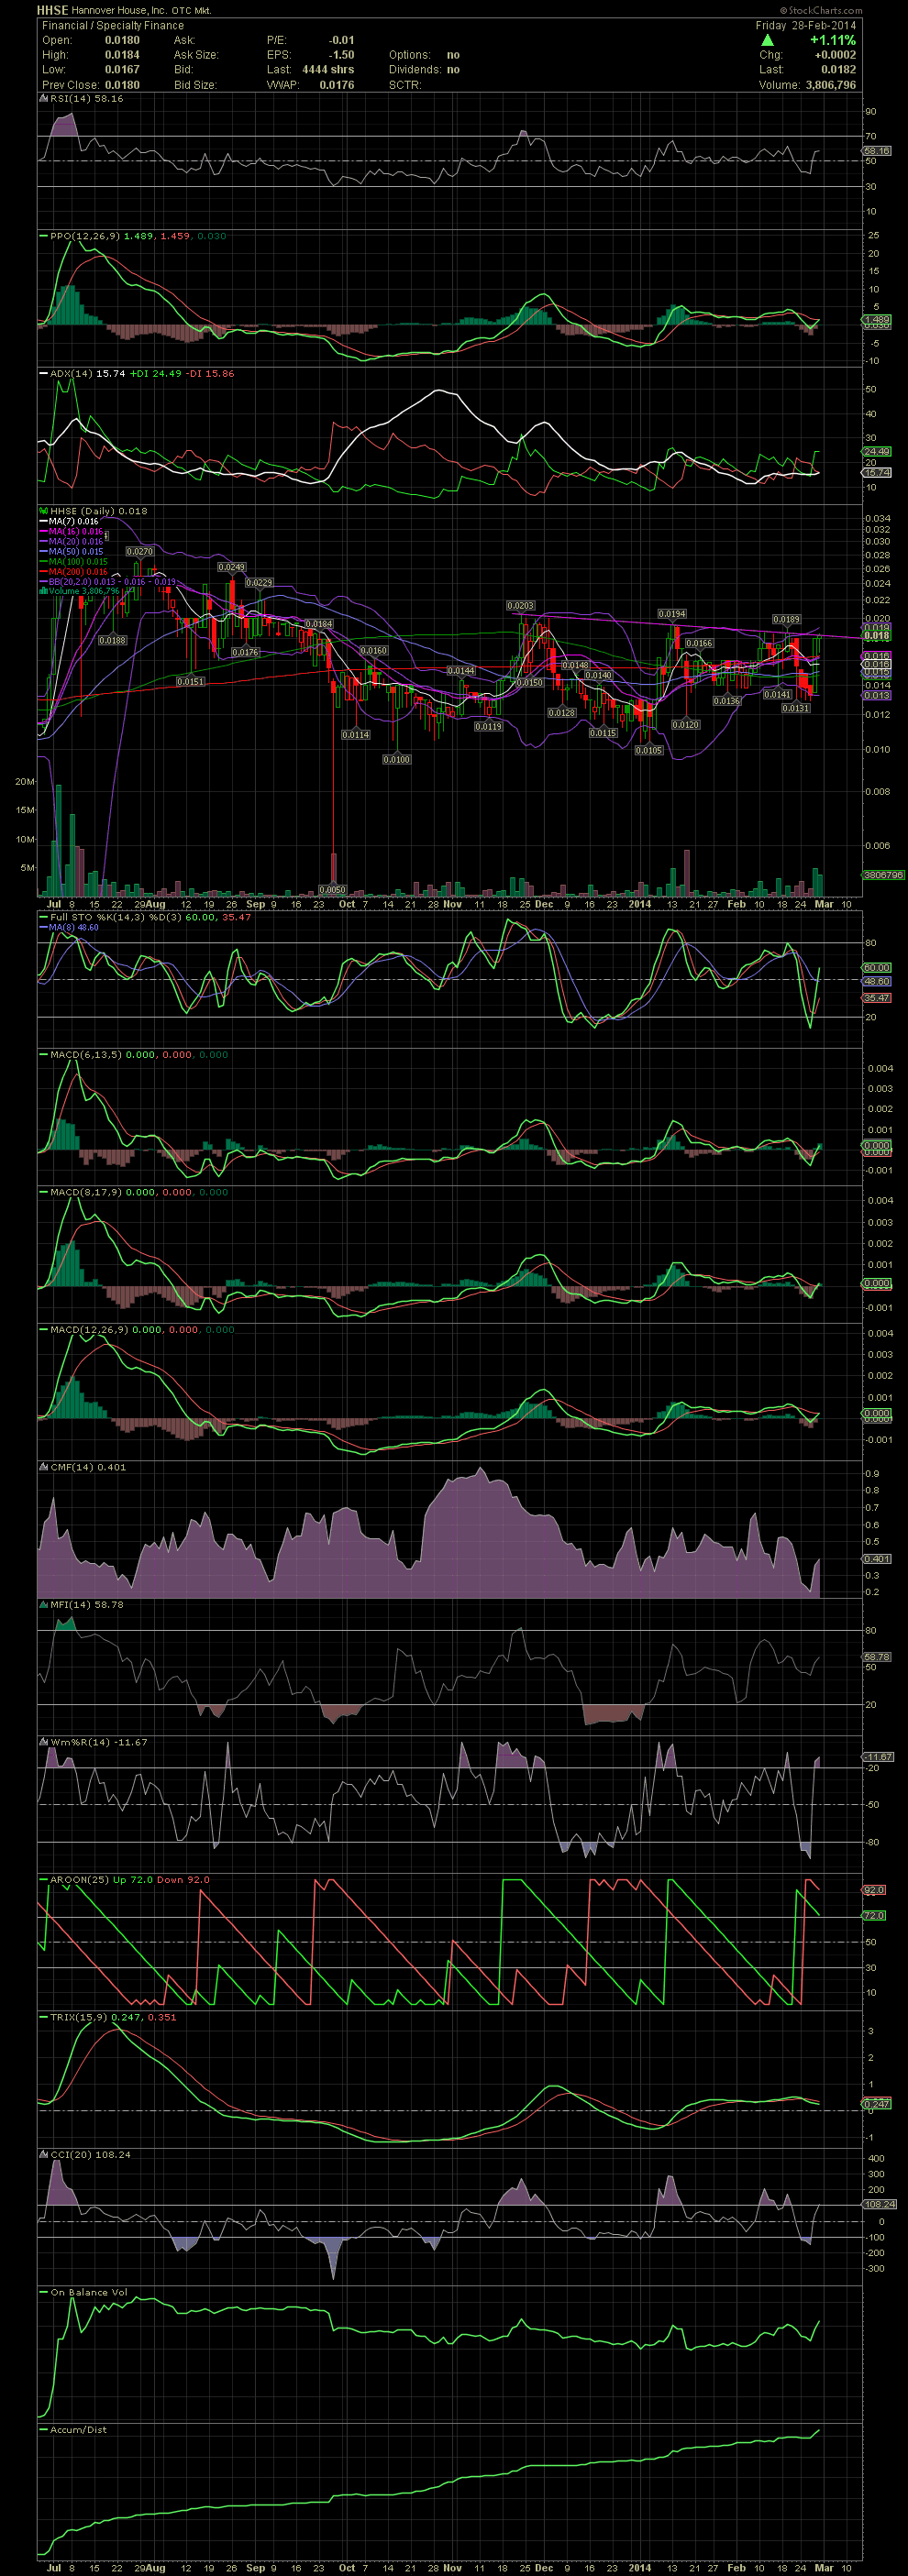
HHSE Daily Chart ~ Watching for a Break Above the
Post# of 2561

I began a position in HHSE on Friday. The stock has been in a slightly negative trend since late November and is being contained by a declining tops line. That top is close to being taken out with the closes of Thursday and Friday. I was bidding all day at .0162, .0165 and 0167 with no luck but hit the ask a couple of times to begin a stake. All the moving averages from the MA7 to the 10, 16, 20, 50, and 100 are in a very tight range at .015-.016. The biggie, MA200, is just above at .0245. The FullSto and MACDs just began moving into a positive crossover with a lot of room to the upside. Should the stock begin taking out the previous highs (view the chart), a test of the .025 and .03s would be in play. I'll be looking to add shares from .018 and down on any dips. GLTA
| 02/28/14 | Bought | 100,000 of HHSE @ $0.017 (Order #745) | -1,707.99 |
| 02/28/14 | Bought | 200,000 of HHSE @ $0.018 (Order #740) | -3,607.99 |

 (0)
(0) (0)
(0)