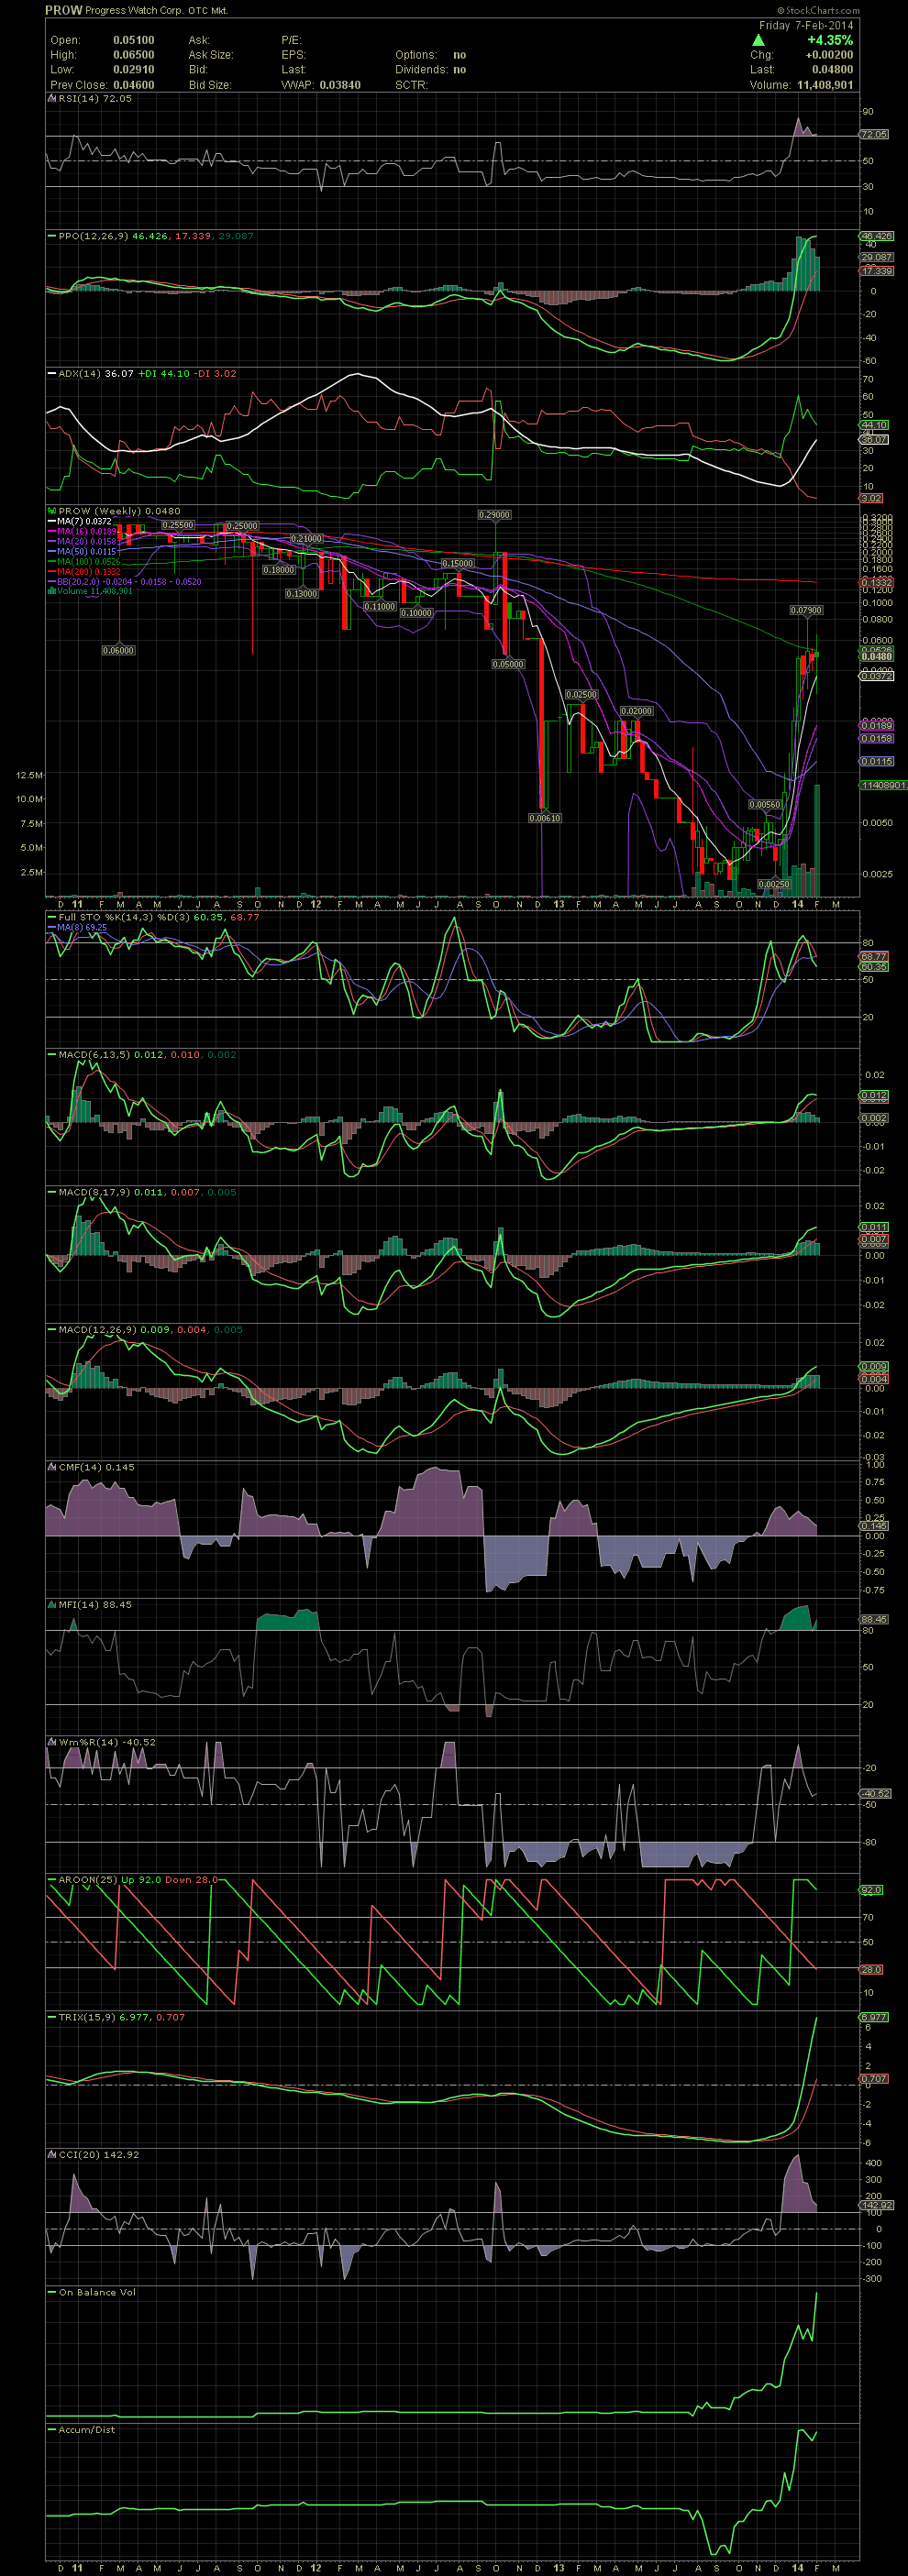
PROW Weekly Chart ~ Getting Ready to Break Over th
Post# of 2561

The Weekly Chart shows the tremendous move from December into January. Imagine that, a stock running more than 30 bags and it's NOT a pot stock. Amazing! A look at the Weekly explains the reason the stock has been stalling on the daily chart near the .05 level. The MA100 is currently sitting at .048, exactly where the stock closed at on Friday. Like I have mentioned many times in the past, don't just use the Daily but take a look at the Weekly and Monthly once a week. Should the stock close over the MA100 on good volume, I would expect it to begin a run to test the MA200 at .1332. PROW is looking like it wants to trade much higher over the next few weeks. GLTA

 (0)
(0) (0)
(0)