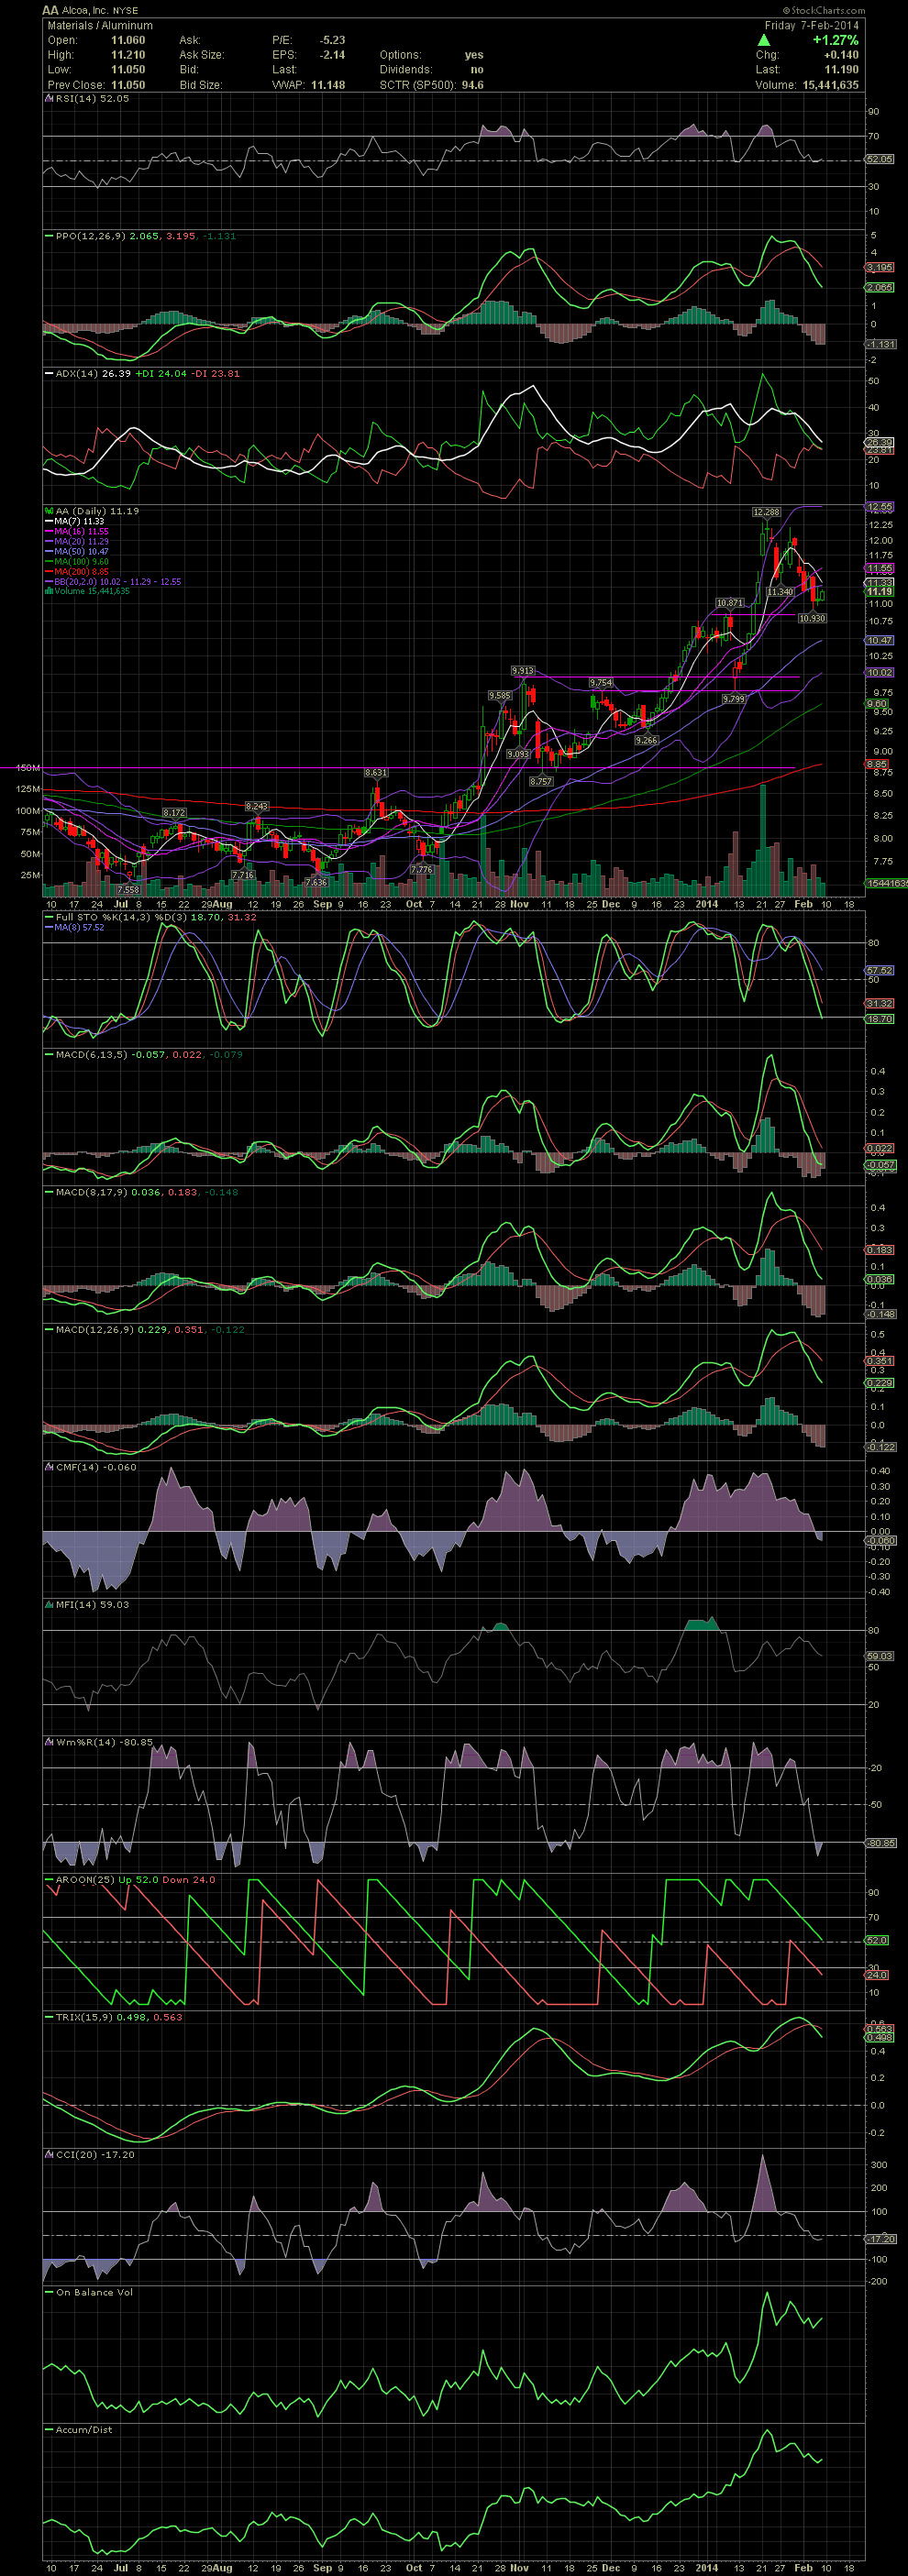
AA Daily Chart ~ Waiting for a Re-Entry The late
Post# of 2561

The latest swing trade exits in the low 12.00s was the right move based on the technicals offered at the time. When the share price was outside the upper bollie, that was signal #1 to take a few off the table since the FullSto and MACDs were ranging at fairly high levels. Although AA has been holding near 11.00 over the last three days, the FullSto and MACDs haven't reset yet. So is the pullback over or do we have more to go on the downside? If AA follows its trading pattern of the last few months, a pullback to a previous high, prior to another leg up, would suggest that the high 10.00s should hold. So maybe the 10.93 was close enough. No idea, so I'll keep watching the chart for a while. GLTA

 (0)
(0) (0)
(0)