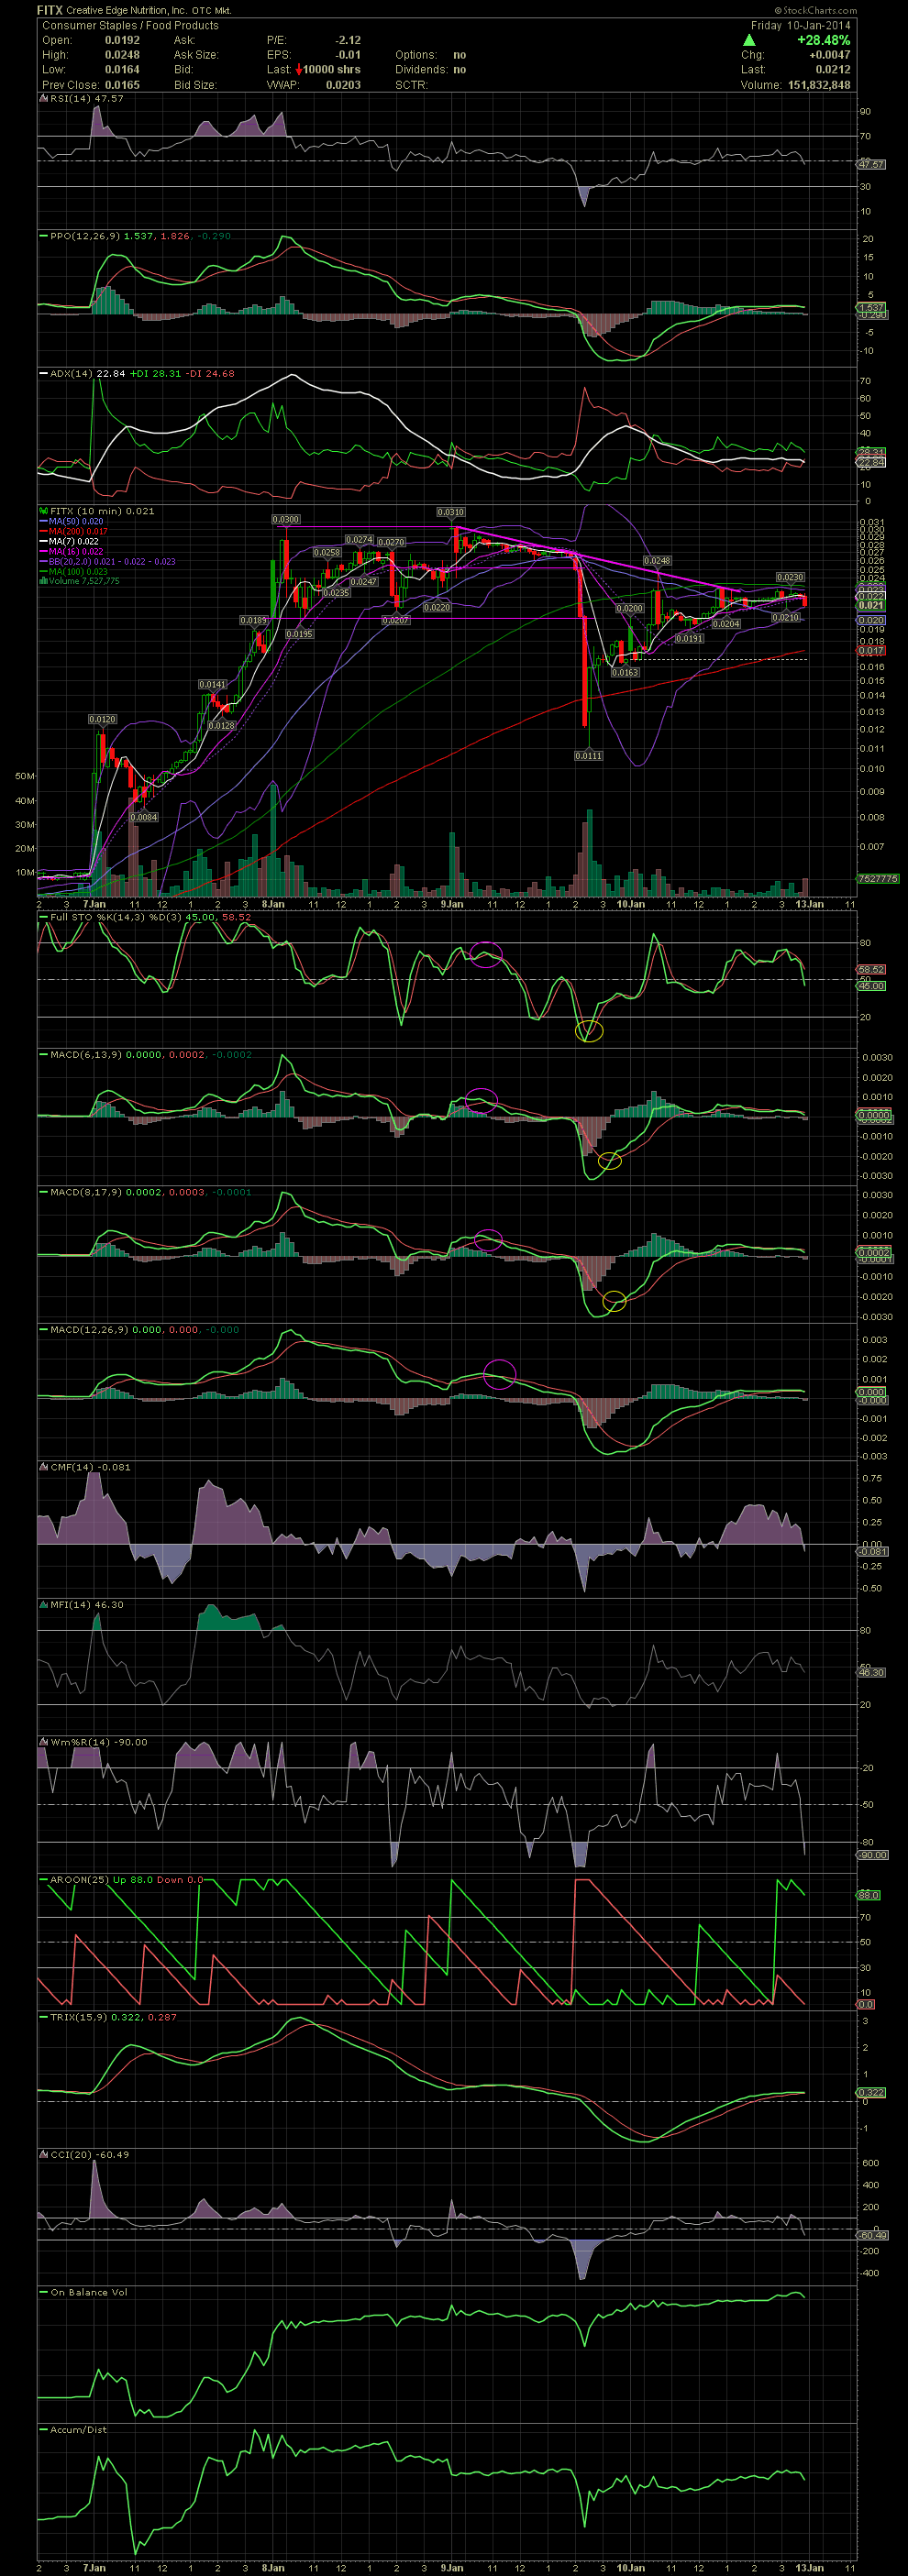
FITX 10 Minute Chart ~ A Four Day View of the Intr
Post# of 2561
Here is the FITX 10 Minute chart for a little bit slower view of the intraday trading over the last four days. Since this is a 10 minute chart, every candle on this chart below is a 10 minute period. I've circled the points where I sold FITX and where I re-entered for a few, which I flipped at .0205. That last flip was probably a mistake as I now find myself a bit underweighted in the share count. But the way the stock closed, with a red candle, might give me an opportunity to add a few more Monday morning. As with the daily charts, one should always pay attention to the indicators if you are swing trading. With the case of a stock that has run from .0025 to .031 within a few days, the 5 and 10 minute charts for an exit are important. Notice who fast the stock fell when a few 'sell' signals or support levels were broken. In an extreme volatile situation, one has to switch to a much faster chart setting that a daily. The two week run, from a double bottom on the daily chart at .002 to .031, is going to have a severe correction at some point. Congrats to all who played FITX. I'm liking the long term potential with this company, but when you are handed a 10+ bagger in a couple of weeks, the smart thing is to take some or all off the table. GLTA

 (0)
(0) (0)
(0)