
FITX 5 Minute Chart ~ A Map to Intraday Trading
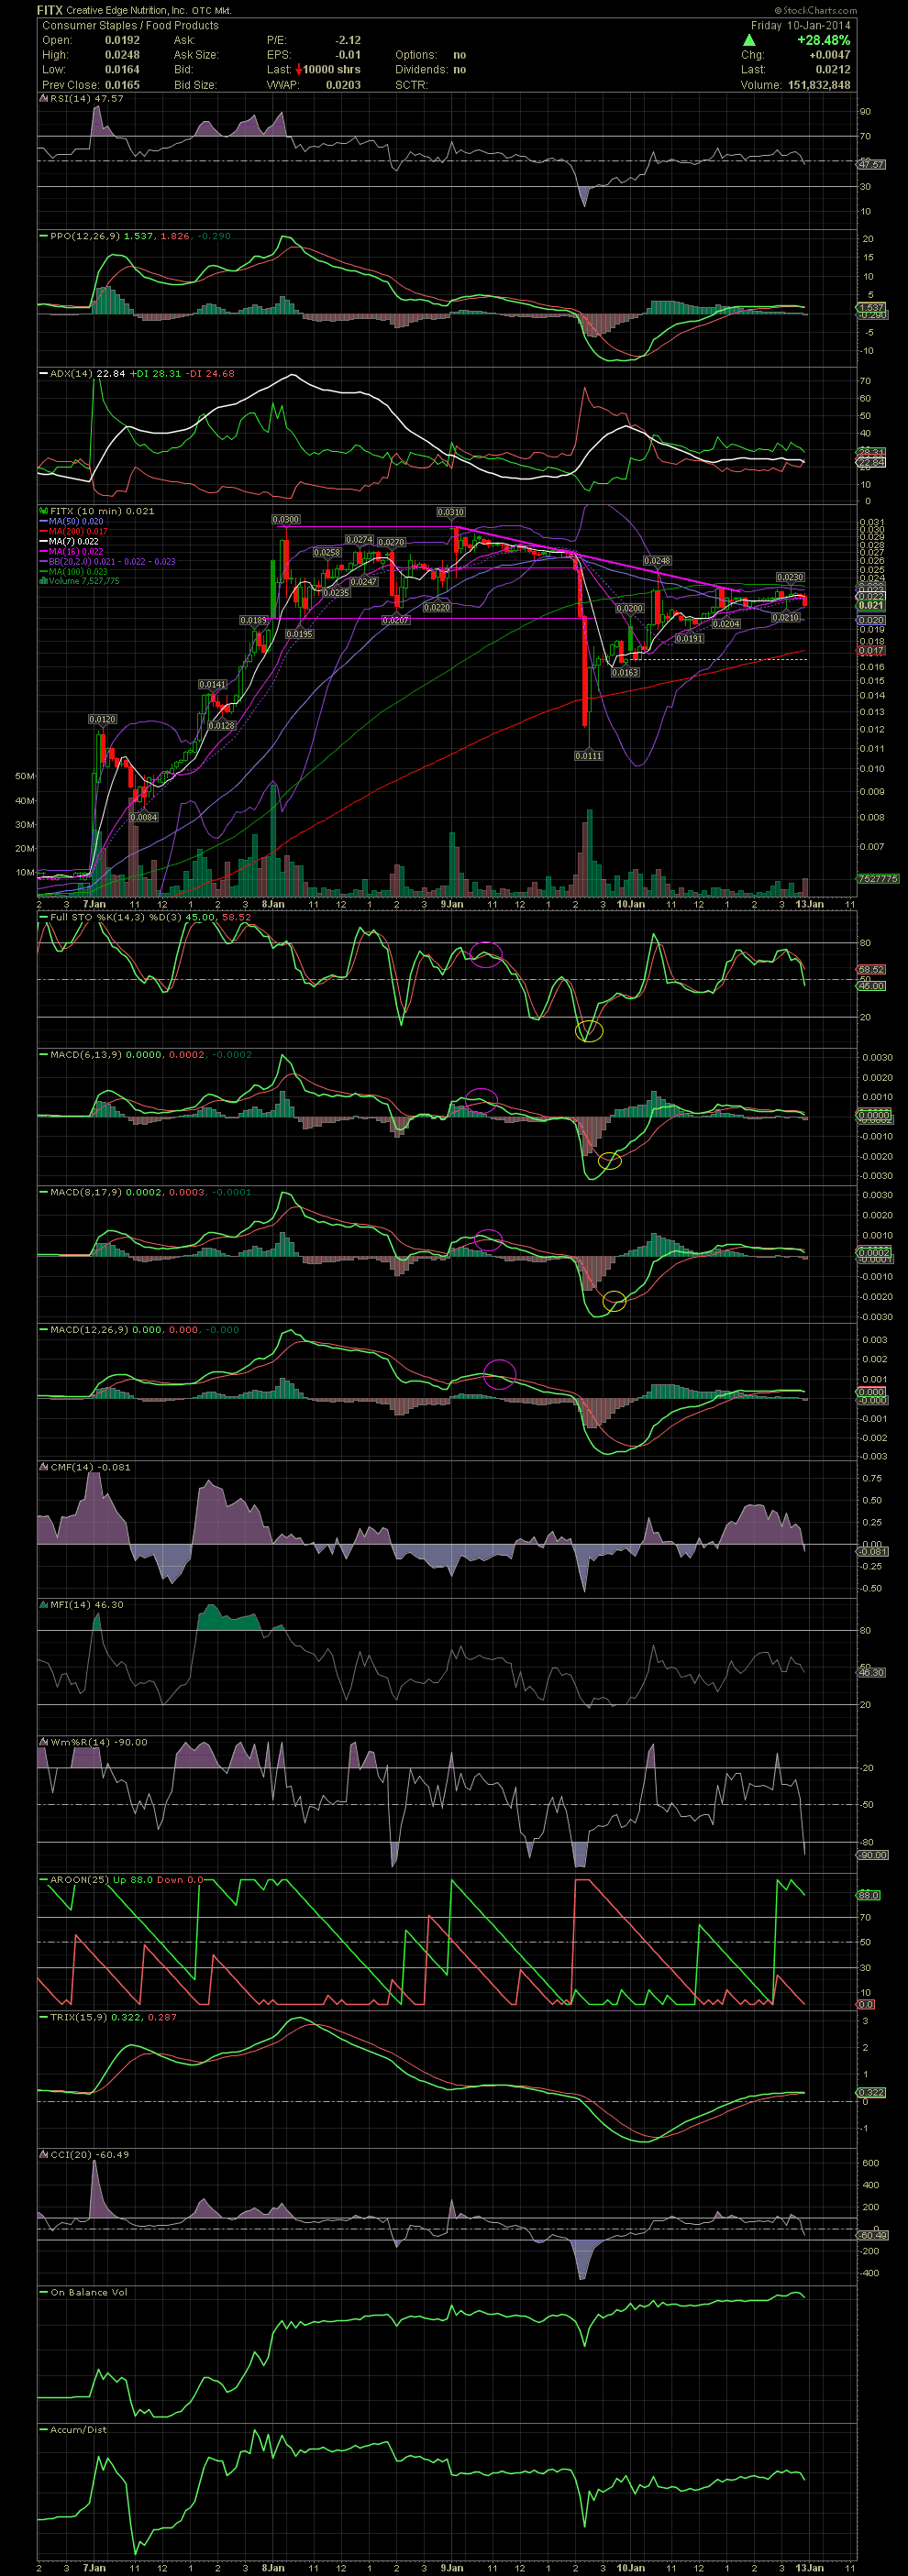
As I just mentioned on the previous FITX post, in order to trade an extremely volatile situation, as FITX was on Thursday and Friday, one needs to shift to a faster chart, such as a 5 or 10 minute chart. On the daily charts, every candle represents one day. On the 5 minute chart below, every candle is a 5 minute interval. As with the daily charts, the FullSto and MACDs are work extremely well. But since these timeframes are just 5 minutes, one doesn't have a lot of time to make a decision. As one can see below, the drop from .026 to .0111 happened in just about 30 minutes after these indicators gave a negative crossover. When these same indicators reversed and crossed to the positive, the stock had already recovered to .016. Friday morning, the bounce was halted by a declining tops line, established during Thursday's trading, and stopped at .0248. A short term rising bottom was also in place which began to contain the downside on Friday morning. So as you can see, chart patterns also appear intraday as they do on the daily and weekly charts. When the FullSto and MACDs shout at me, I have two choices. I can sit on my hands and do nothing, or I can take some action with a trade. Although I was completely out of the stock 30 minutes before the close, I did pick up a few as a just in case there's some big news prior to the opening on Monday. The CEO is promising a huge future for FITX shareholders, so I found it necessary to buy a few back. GLTA
As I just mentioned on the previous FITX post, in order to trade an extremely volatile situation, as FITX was on Thursday and Friday, one needs to shift to a faster chart, such as a 5 or 10 minute chart. On the daily charts, every candle represents one day. On the 5 minute chart below, every candle is a 5 minute interval. As with the daily charts, the FullSto and MACDs are work extremely well. But since these timeframes are just 5 minutes, one doesn't have a lot of time to make a decision. As one can see below, the drop from .026 to .0111 happened in just about 30 minutes after these indicators gave a negative crossover. When these same indicators reversed and crossed to the positive, the stock had already recovered to .016. Friday morning, the bounce was halted by a declining tops line, established during Thursday's trading, and stopped at .0248. A short term rising bottom was also in place which began to contain the downside on Friday morning. So as you can see, chart patterns also appear intraday as they do on the daily and weekly charts. When the FullSto and MACDs shout at me, I have two choices. I can sit on my hands and do nothing, or I can take some action with a trade. Although I was completely out of the stock 30 minutes before the close, I did pick up a few as a just in case there's some big news prior to the opening on Monday. The CEO is promising a huge future for FITX shareholders, so I found it necessary to buy a few back. GLTA