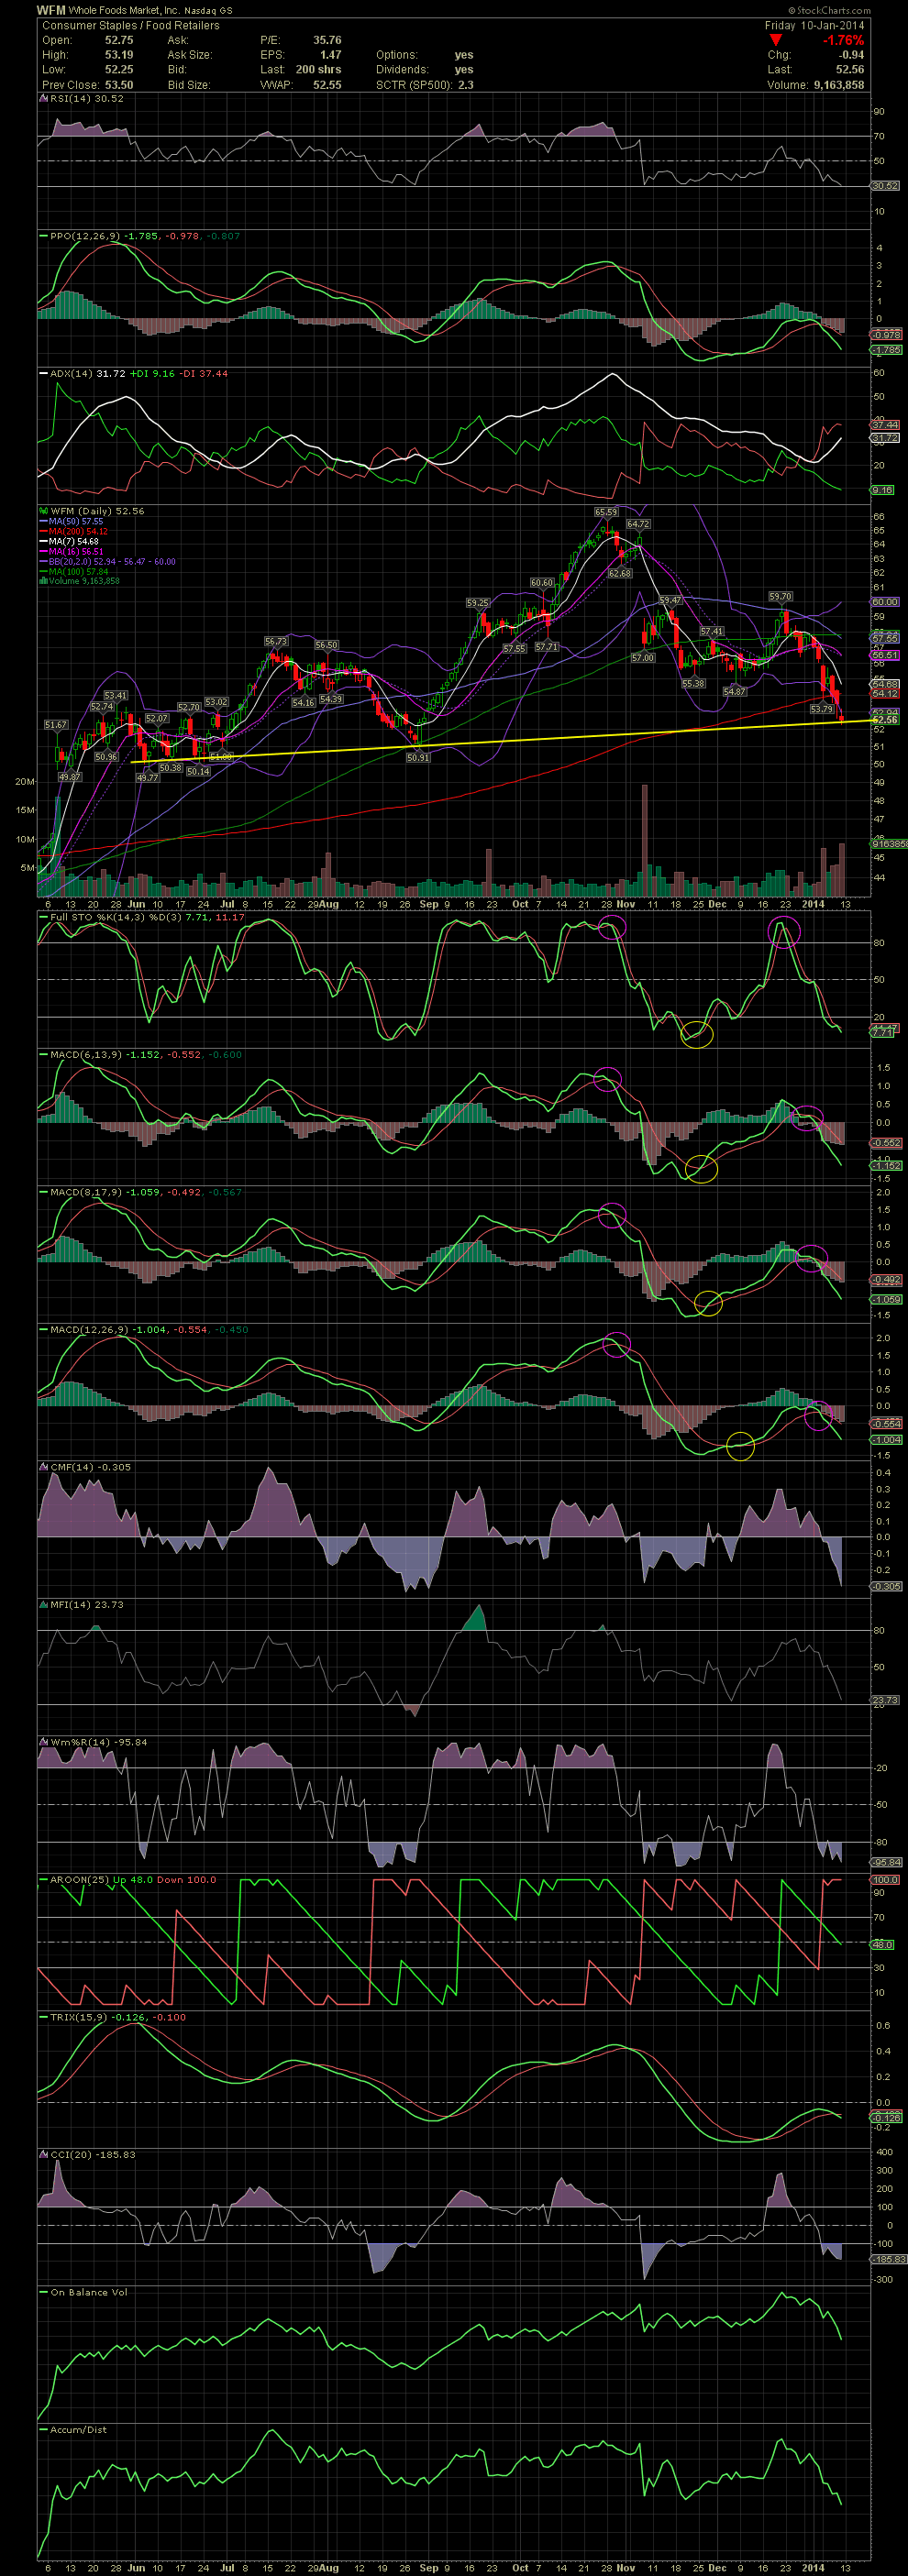
WFM Daily Chart ~ Entering Oversold Levels Here'
Post# of 2561

Here's another request for a chart. The decline in Whole Foods has been in place since late October with a slight bounce in late November. I've circled the last three signals to assist anyone who might not know what I'm referring to with the positive and negative crossovers of the FullSto and MACDs. These indicators are still in a negative formation and suggesting there might be a bit more downside. What's interesting on the chart is the support line that WFM has fallen to. Will that hold or dow the stock fall more. I'm guessing more since WFM is now below the MA200 and the selling volume has been increasing daily. Allow the charts to assist you with the direction and momentum. If one looks at the extreme left side of the chart, you'll also see a gap down to 46.50 which might be where the stock is going. GLTA

 (0)
(0) (0)
(0)