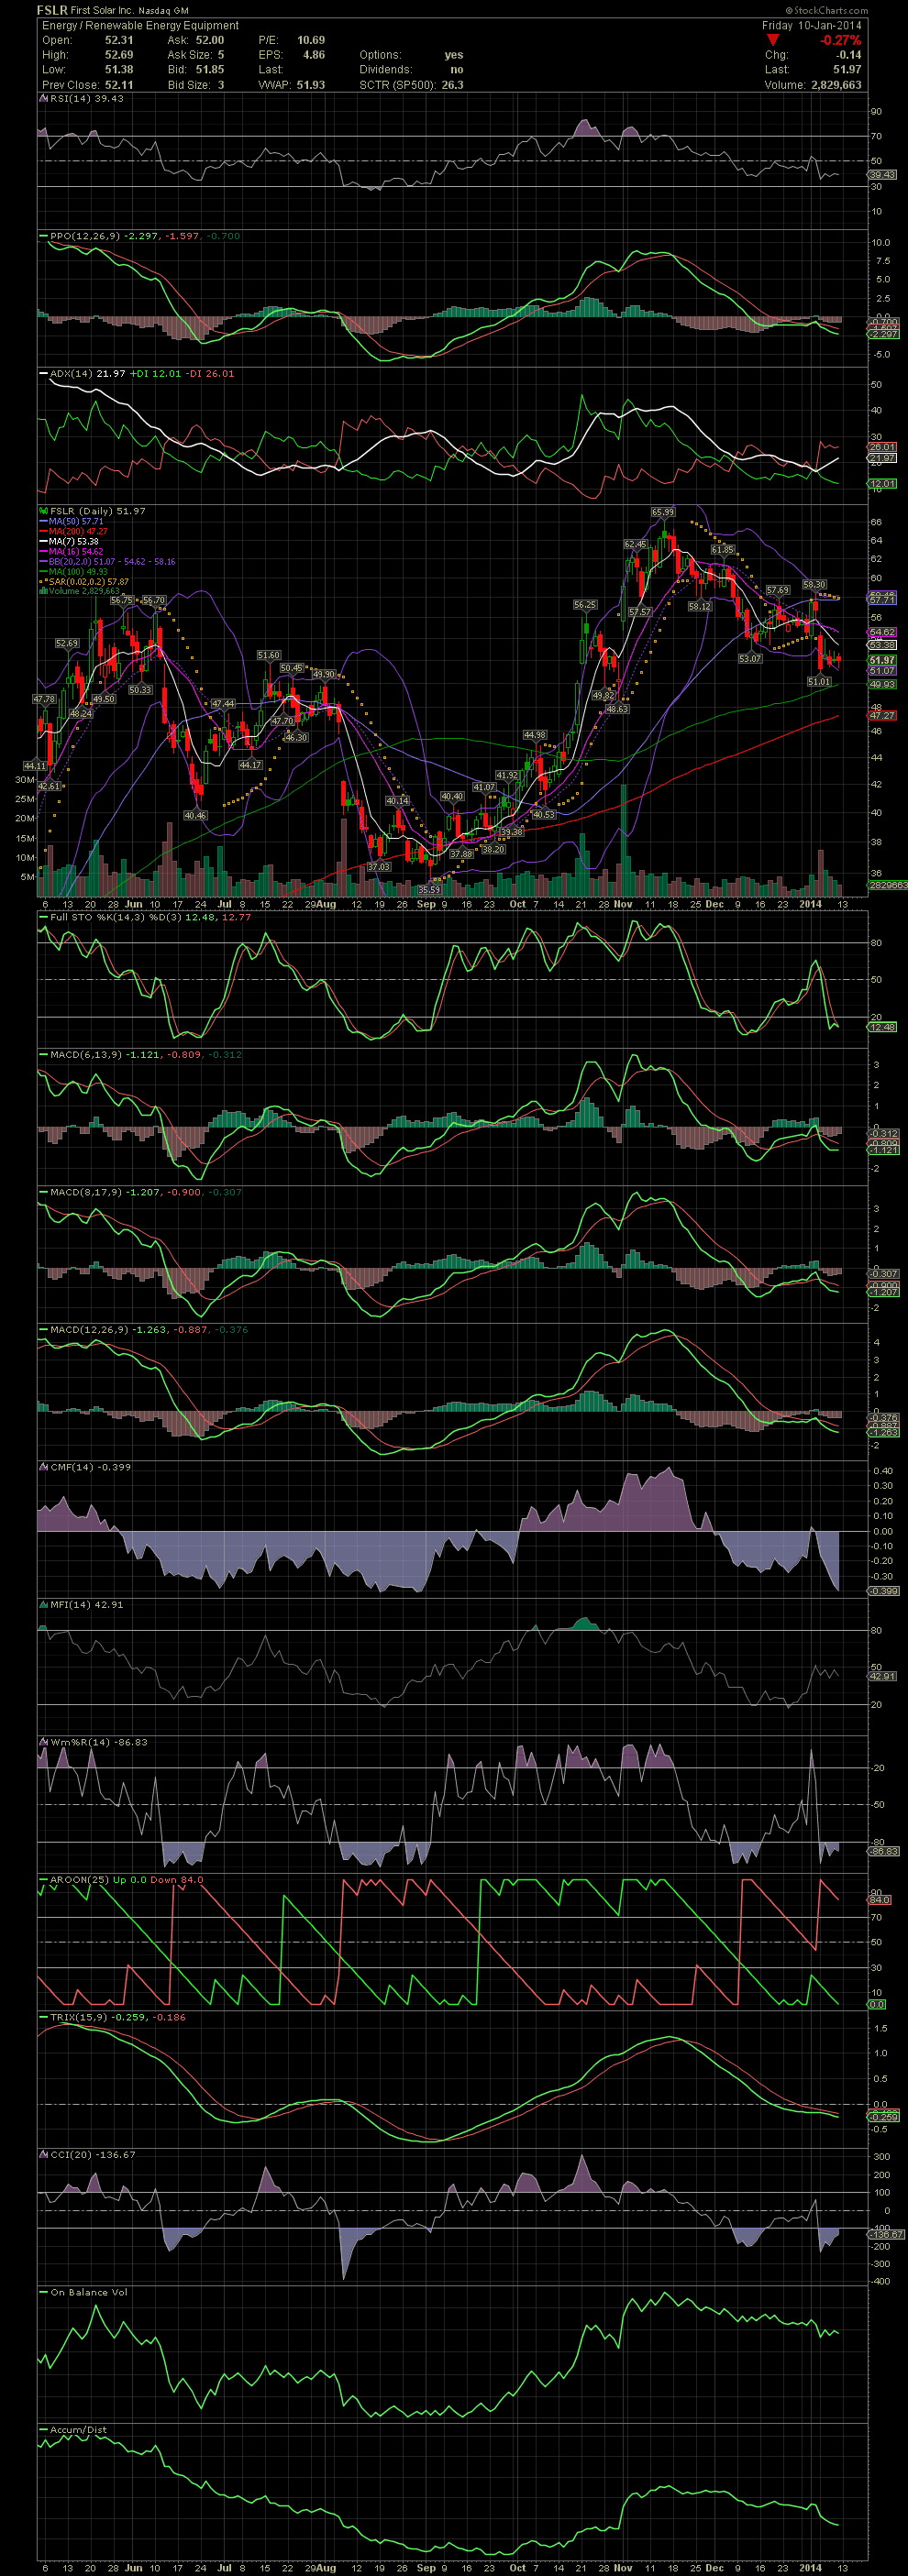
FSLR Daily Chart ~ Decline Continuing I was aske
Post# of 2561

I was asked for some thoughts on the FSLR chart. As all can see, the FullSto and MACDs went negative with crossovers to the downside in mid November. That trend continues today. As to the moving averages, when the stock broke under the MA50, there were two attempts to close back over it, but they both failed. FSLR will probably end up testing the MA100 and 200 before a reversal to the upside. Other than some consolidation this week at the 51/52.00 level, I don't see much that would entice me to jump in. As always, strong material news would trump the technicals. But for now, I would wait for the indicators to show a reversal of the negative momentum underway. GLTA

 (0)
(0) (0)
(0)