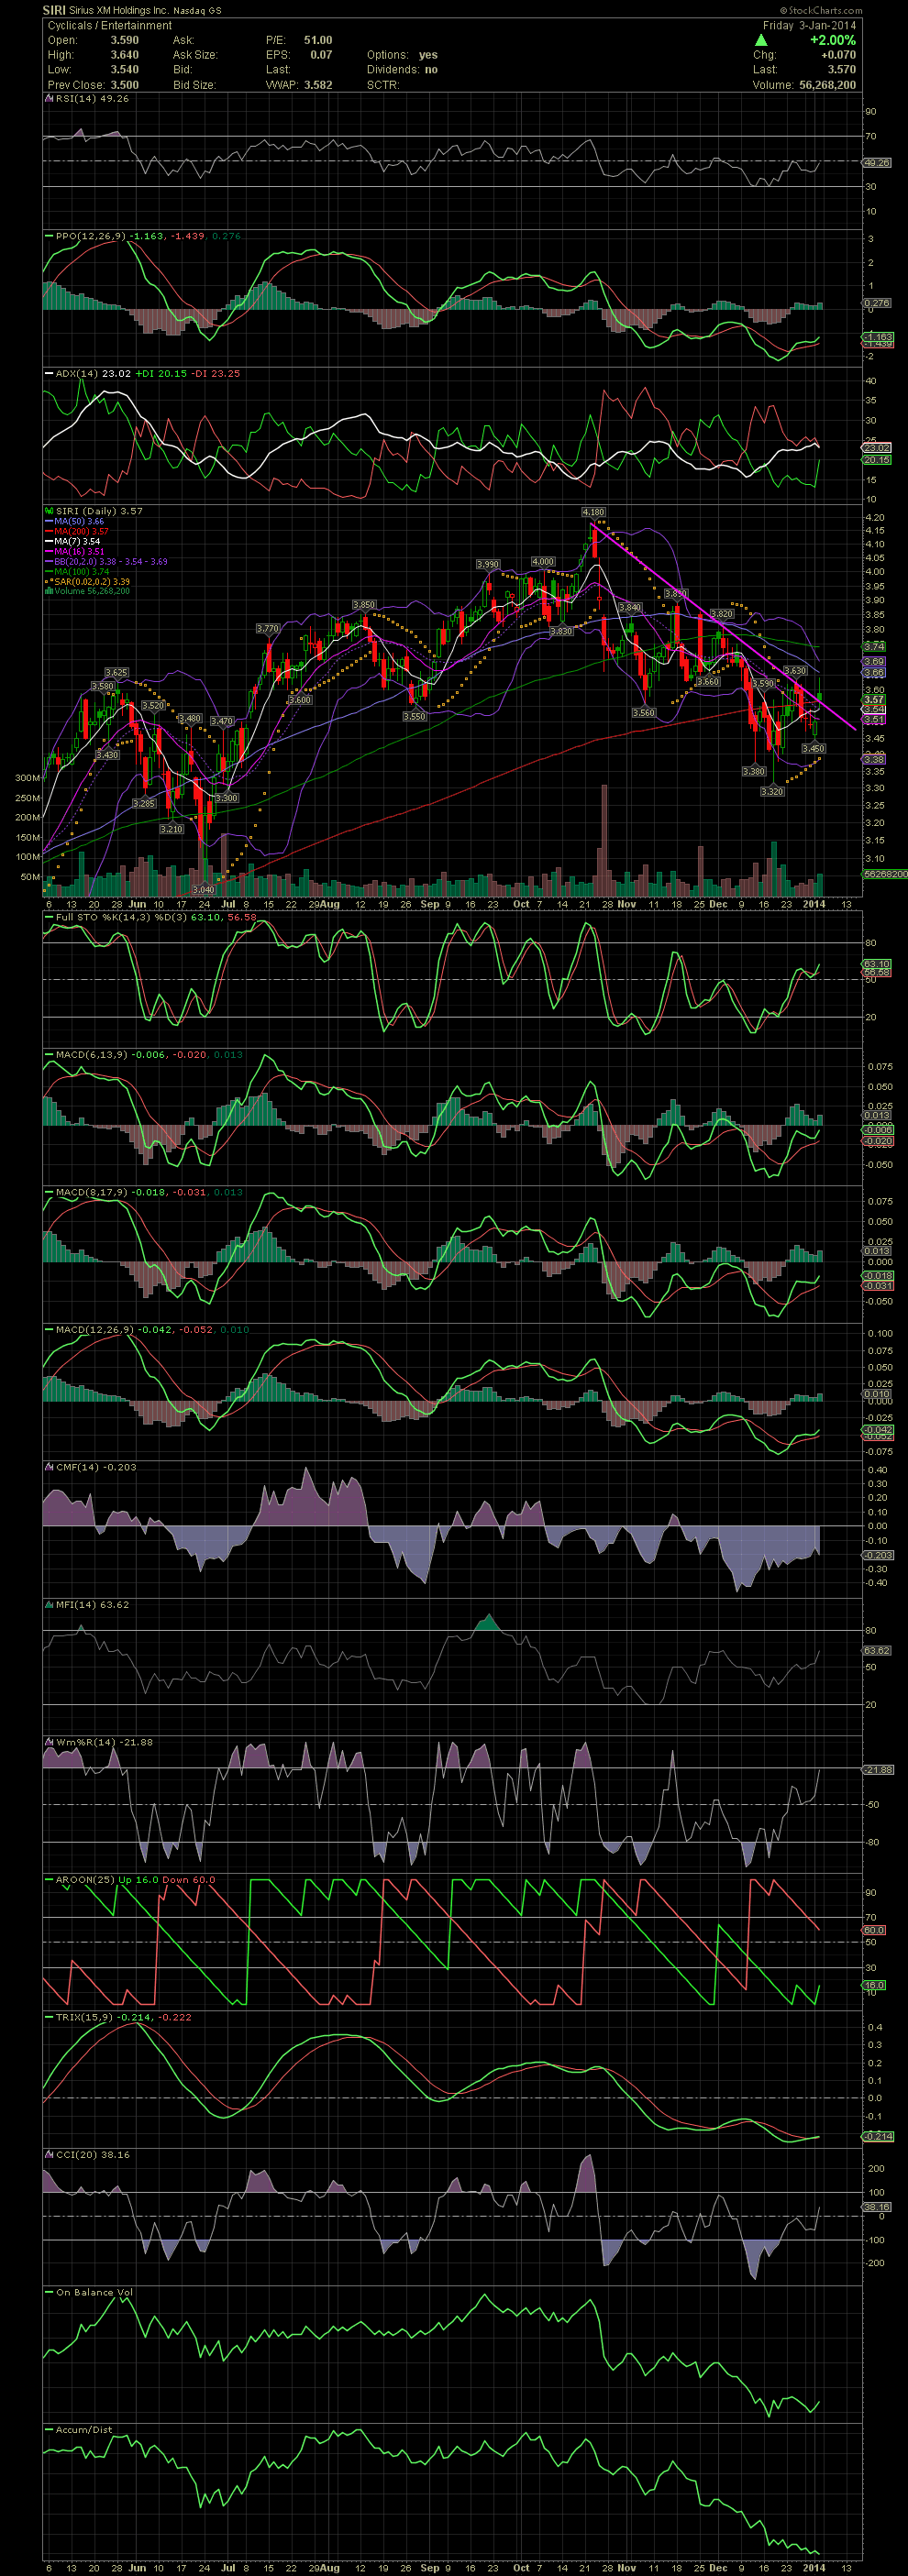
SIRI Daily Chart ~ Above Its Declining Tops Line
Post# of 2561
It's probably best to link back to the post I'm responding too for an understanding of what I was hoping for in SIRI. The drop below the MA200, and it did see the 3.30 level but no low 3.00s. Anyway, the bottom is clearly in but I can't quite declare that a reversal is in place.....yet. As we saw with SIRI in November, a rising stock price in happening. Previously the declining tops line contained a reversal. My last swing trade in SIRI was only good for a few cents. I did re-enter SIRI at 3.60 but only for 2k shares so far. As you can see, Friday's trading took SIRI over the declining tops line for the first time since the high in late October. Additionally, the stock closed above the MA200. In the very short term, SIRI needs to close at 3.64 to confirm a reversal and breakout. A close above the MA50 would be additional confirmation. The MA100, less followed than the MA50 and 200 is sitting at 3.74. Should these targets be hit, then the 3.80s are next and an eventual attempt at a new high at 4.19. SIRI has treated us well in the past. Much easier to bank with an uptrending stock than with what we've seen the last two months. Fingers crossed! GLTA

 (0)
(0) (0)
(0)