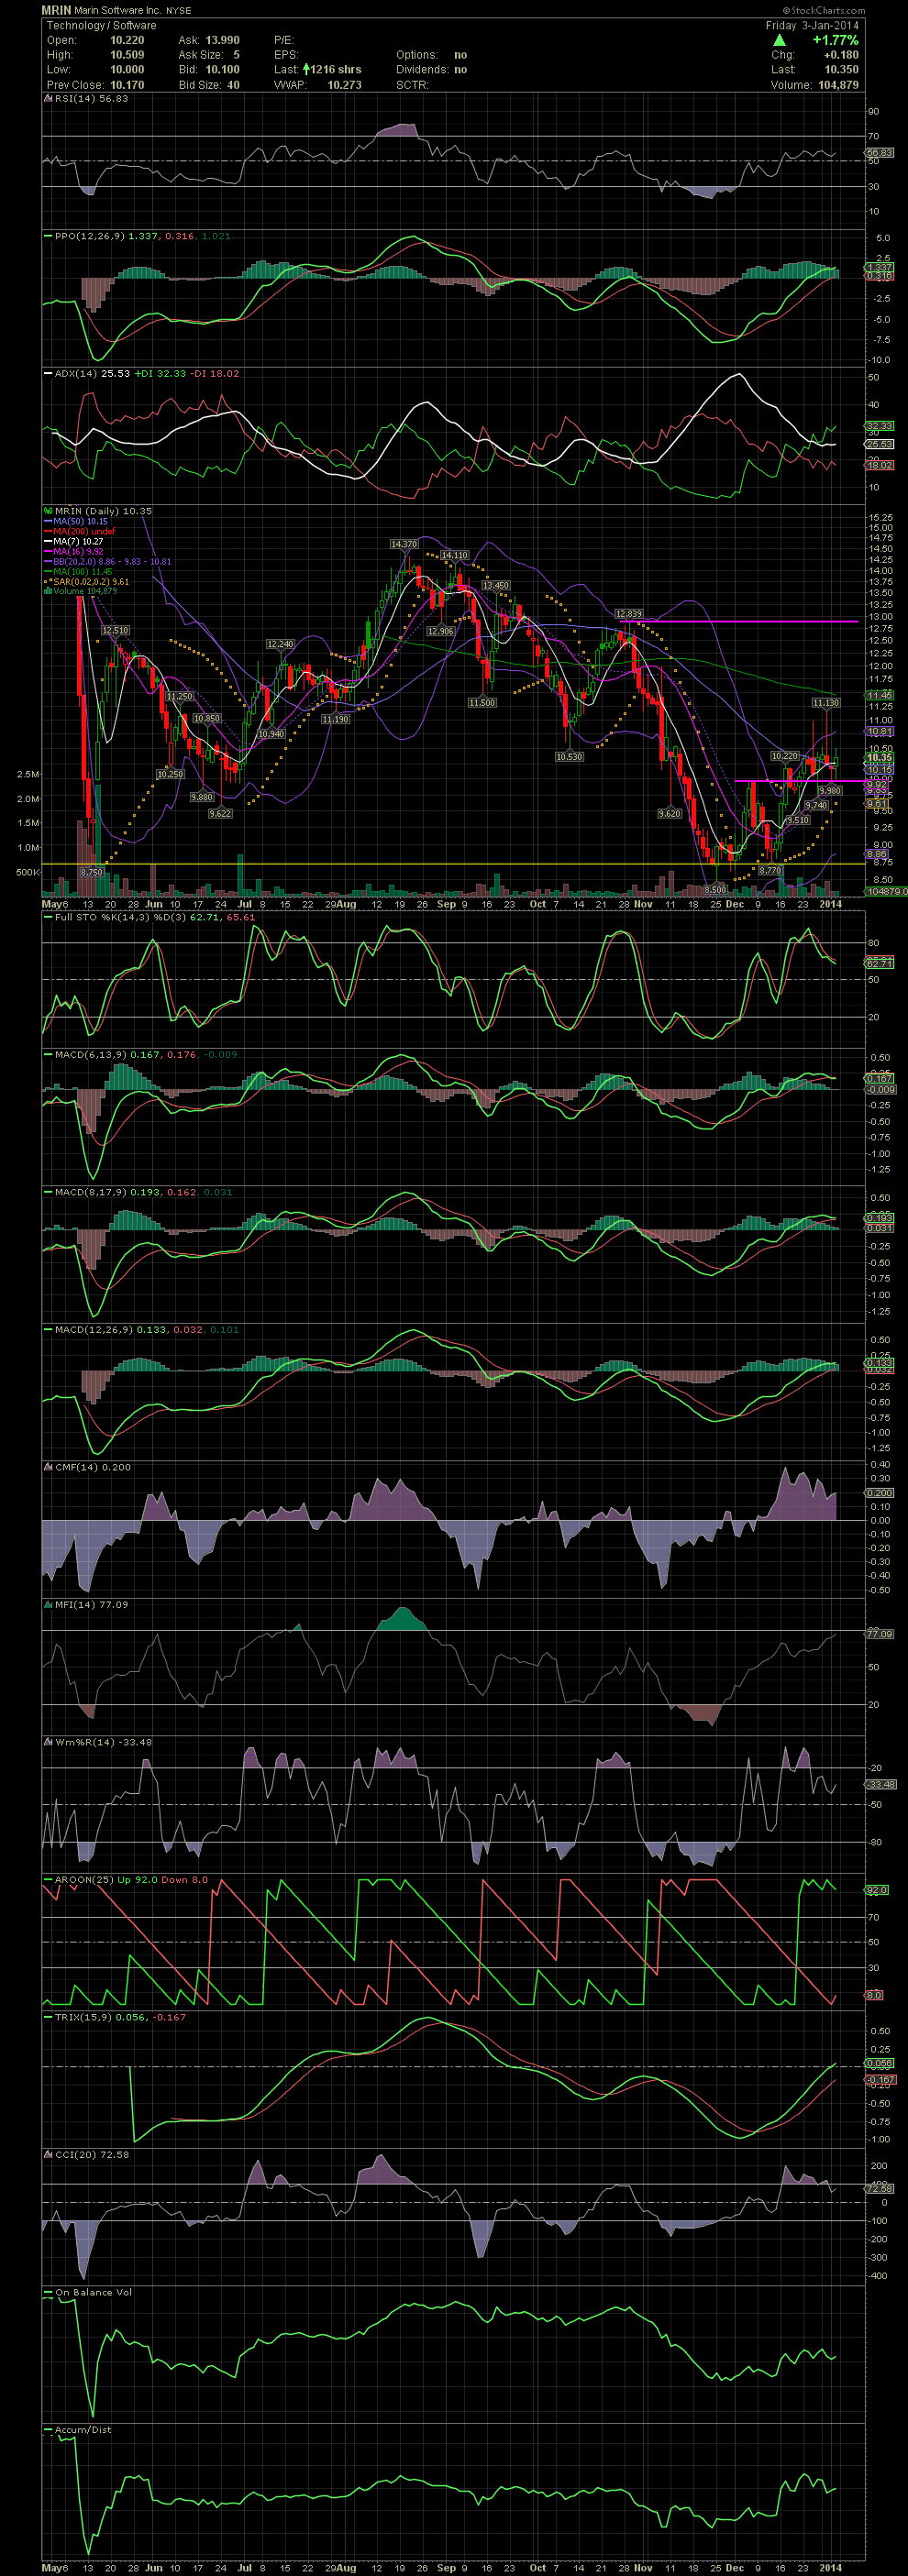
MRIN Daily Chart ~ Holding the Support Line for No
Post# of 2561
Link back to my MRIN post of Jan 1 for previous thoughts regarding the trading outside the upper bollies on MRIN. The stock continues to trade and close above the previous high of the high 9.00s. The stock is beginning to trade in a channel with the 9.90s on the low side and the 10.50 level as the upper channel line with the exception of the two red candle wicks seen on the chart. I'm currently in my third second swing trade while a few friends are in their third and fourth. My initial target remains the MA100 which continues to gradually decline as it factors in the previous 100 trading days. MRIN is very volatile, so if you are in it, swing trade the heck out of it. GTLA

 (0)
(0) (0)
(0)