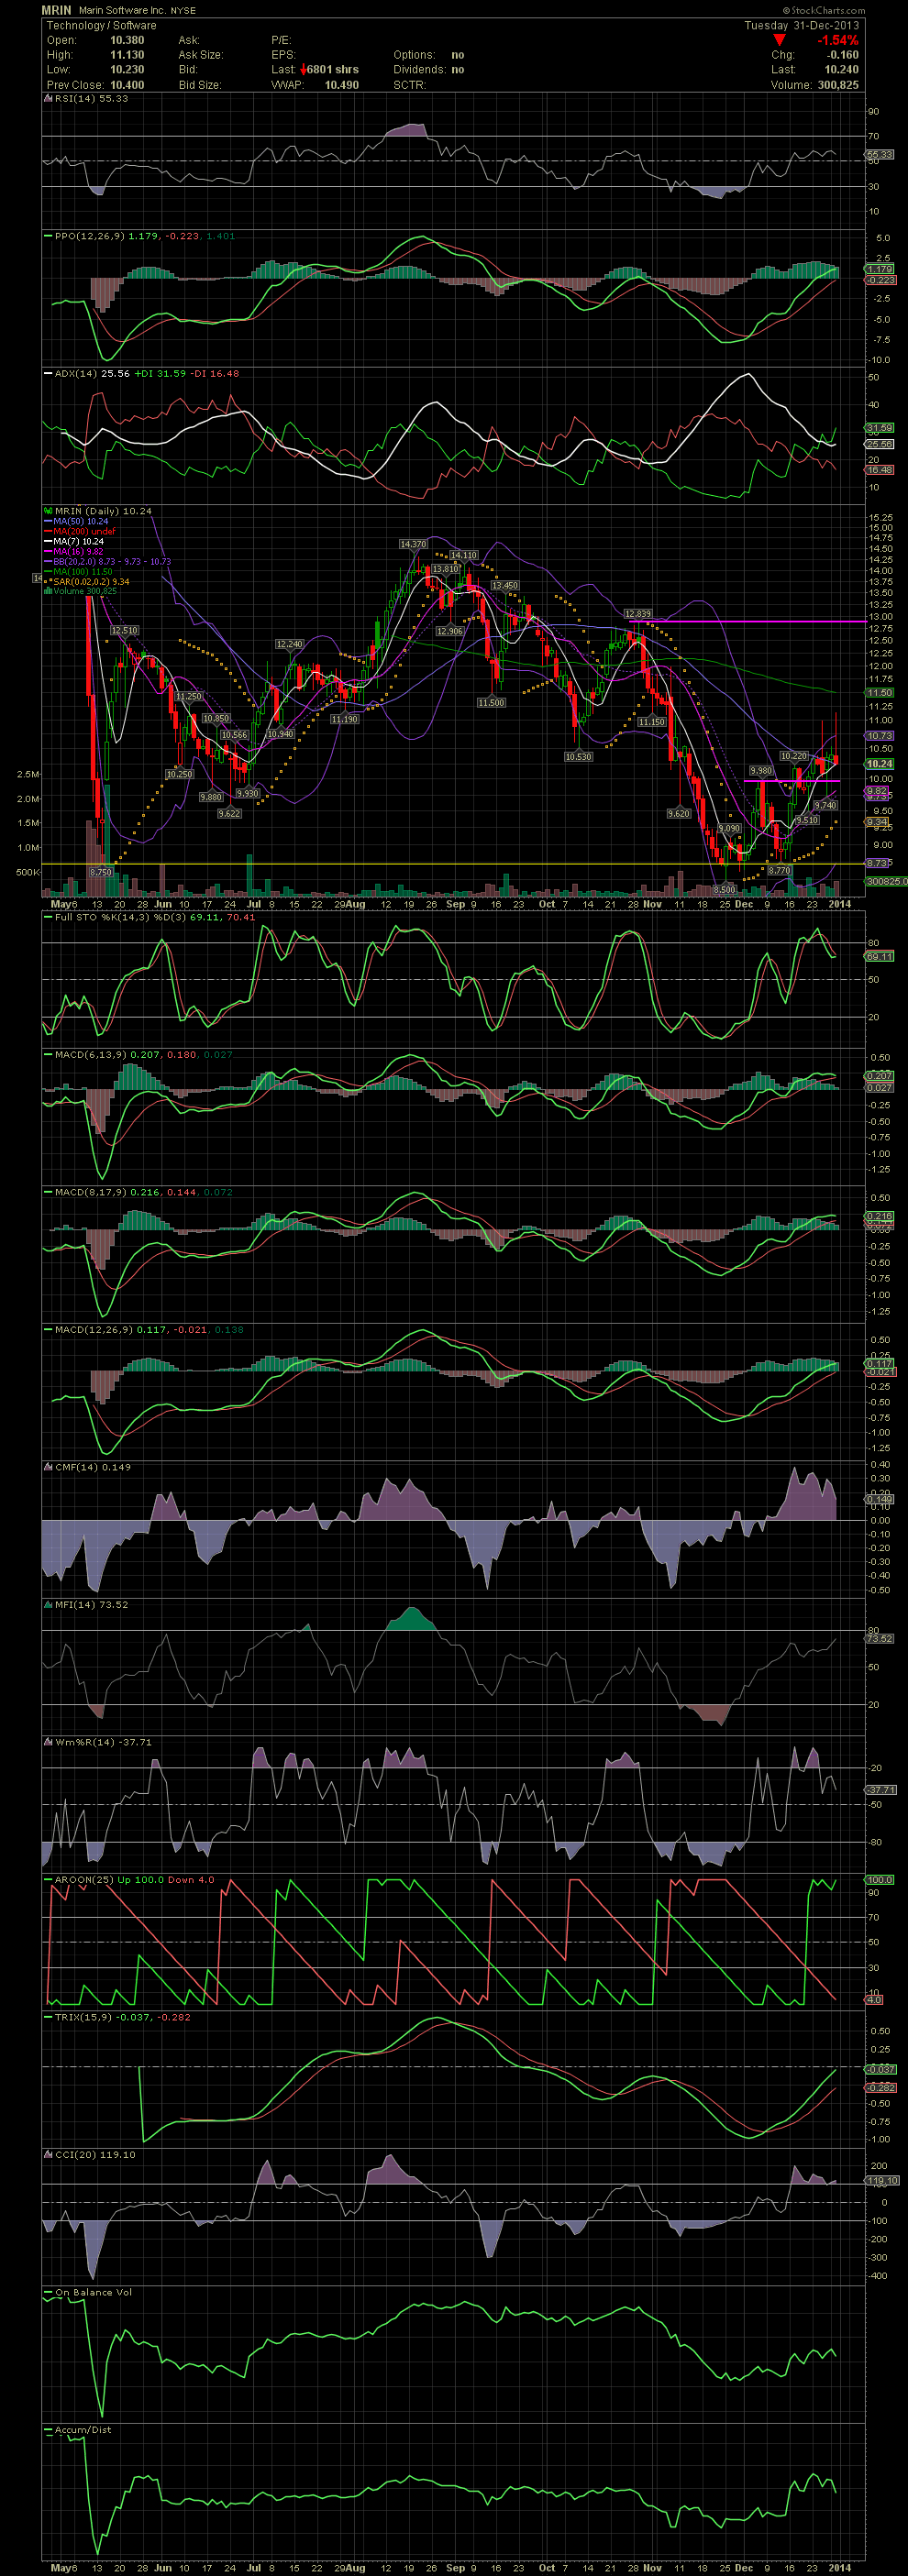
MRIN Daily Chart ~ Paying Attention to the Upper B
Post# of 2561

As I mentioned previously, I was out last Friday and missed a sell on MRIN when the stock got way outside the upper bollie. I didn't make that mistake a second time when the same occurred on Tuesday. Check the candle wicks on MRIN of those two days. It may not sound like a lot, but when a 10.00 stock moves to 11.13 outside the upper bollie, and then proceeds to drop to 10.23, that almost 9% intraday. Friday saw about a similar move when the stock hit 10.99 and fell to 10.03, and to 9.73 the next morning. So one can sit and hold at 10.00 and be up 2% now or have traded both of those easy calls for a gain of over 20% in two days. Those two days could be chalked up as tax loss selling into the two quick moves up since the stock is still down a lot from previous months. Now that the tax loss selling season is over, maybe MRIN will be given some room to breath. I would now be looking at the MA100 at 11.50 as a possible short term target for those of you swing trading this stock. The MACDs have plenty of room to run. GLTA

 (0)
(0) (0)
(0)