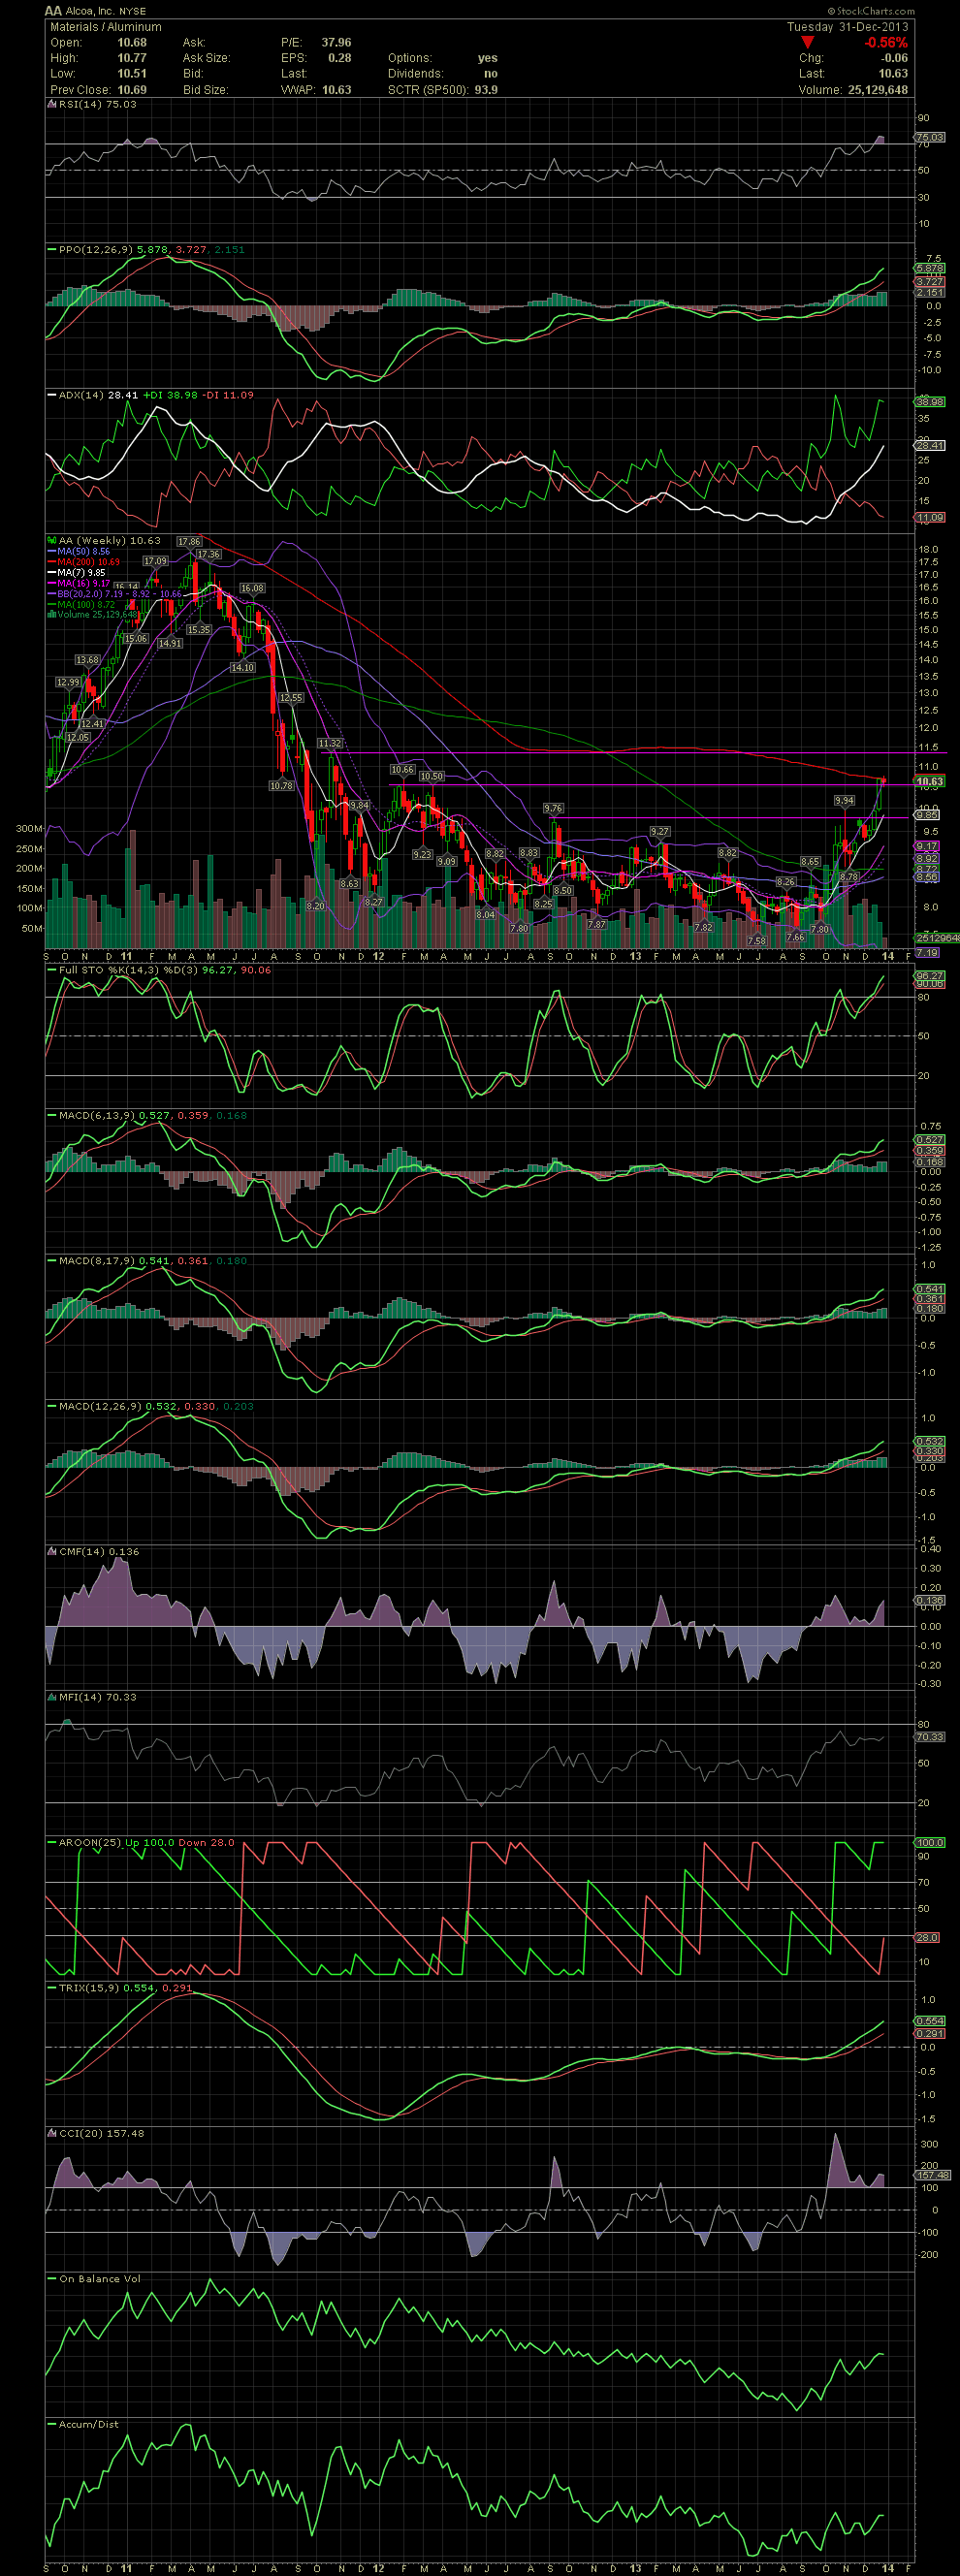
AA Weekly Chart ~ Holding the Second Line of Resis
Post# of 2561

After breaking thru a horizontal resistance level in the previous week, AA held above the 10.50 level all week. Of interest is the MA200 which has contained AA for the two week period. A break above that Weekly indicator would suggest a move towards the next horizontal resistance of 11.32. I don't trade off the Weekly but do review it to see what some longer term technical traders might be looking at. My opinion of AA remains the same. As the global economy gradually continues to improve, AA could see the $20.00s some day. In the meantime, we'll swing trade the stock to increase our overall returns. GLTA

 (0)
(0) (0)
(0)