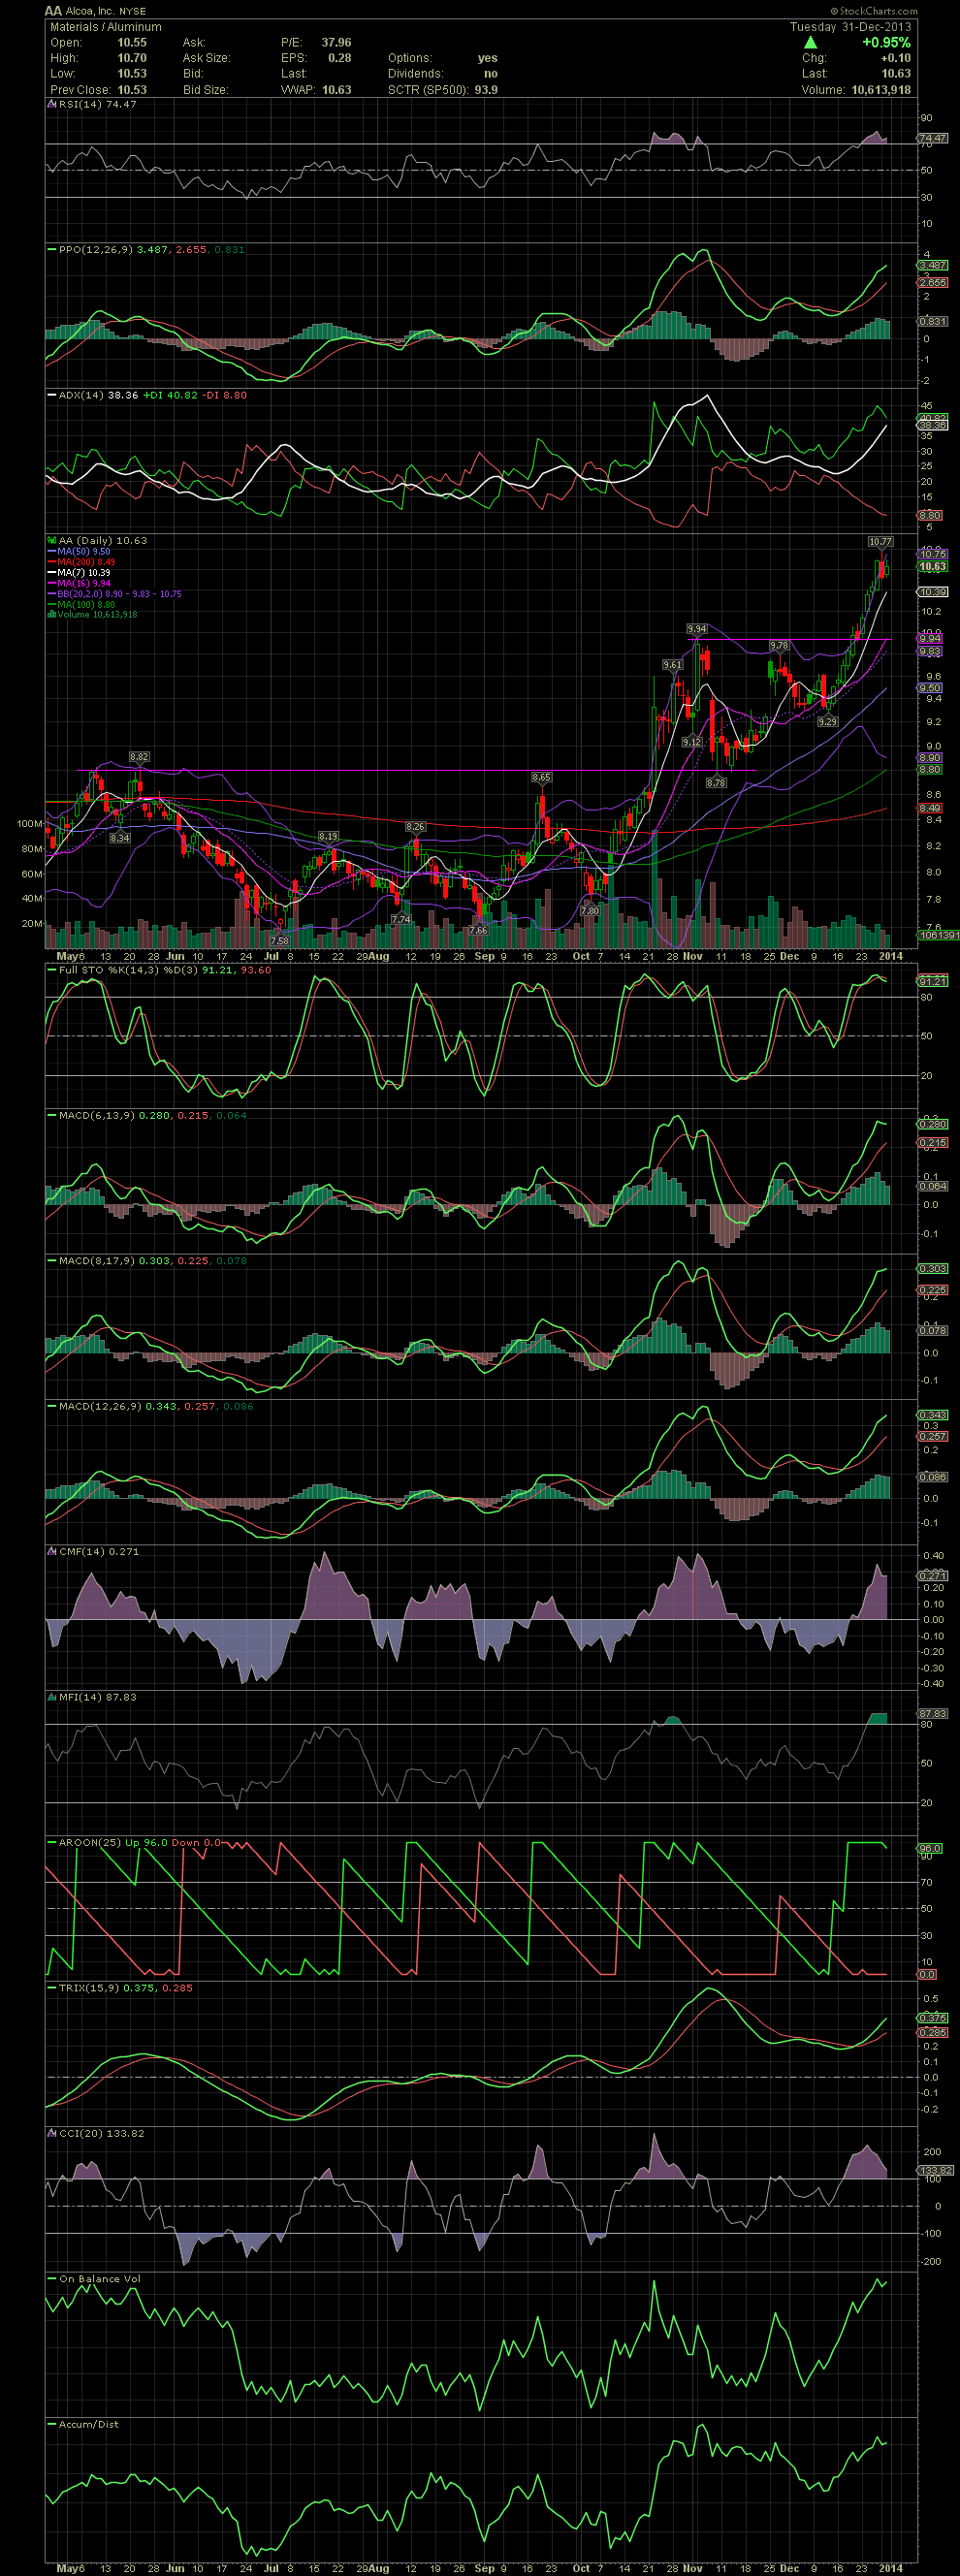
AA Daily Chart ~ Ready for a Rest? AA has moved
Post# of 2561

AA has moved quickly over the last couple of weeks and is well above all of its moving averages. The closest is the MA7 at 10.39 with the MA20 at 9.83. I'm still in the latest swing trade from the 8.80/8.90s with an add to my position in the 9.10s. Although the FullSto is in overbought territory, it's a much faster indicator than the MACDs. If you look at the FullSto in mid October, it trended above the 80 line for almost one month while the MACDs continued to rise. All of those are now reaching levels of the previous correction which began when AA hit 9.94. Should AA's chart give a sell signal, I'll be out and looking for the next swing trade re-entry. A possible support level, should this occur, would be the previous high of 9.94. Look back at the previous support in November. That support was the previous levels of May and September. Boring, yes, but consistent 10-25% swing trades if one follows the chart. Not bad for a Big Board stock. GLTA

 (0)
(0) (0)
(0)