
AA Weekly Chart ~ The Bigger Picture
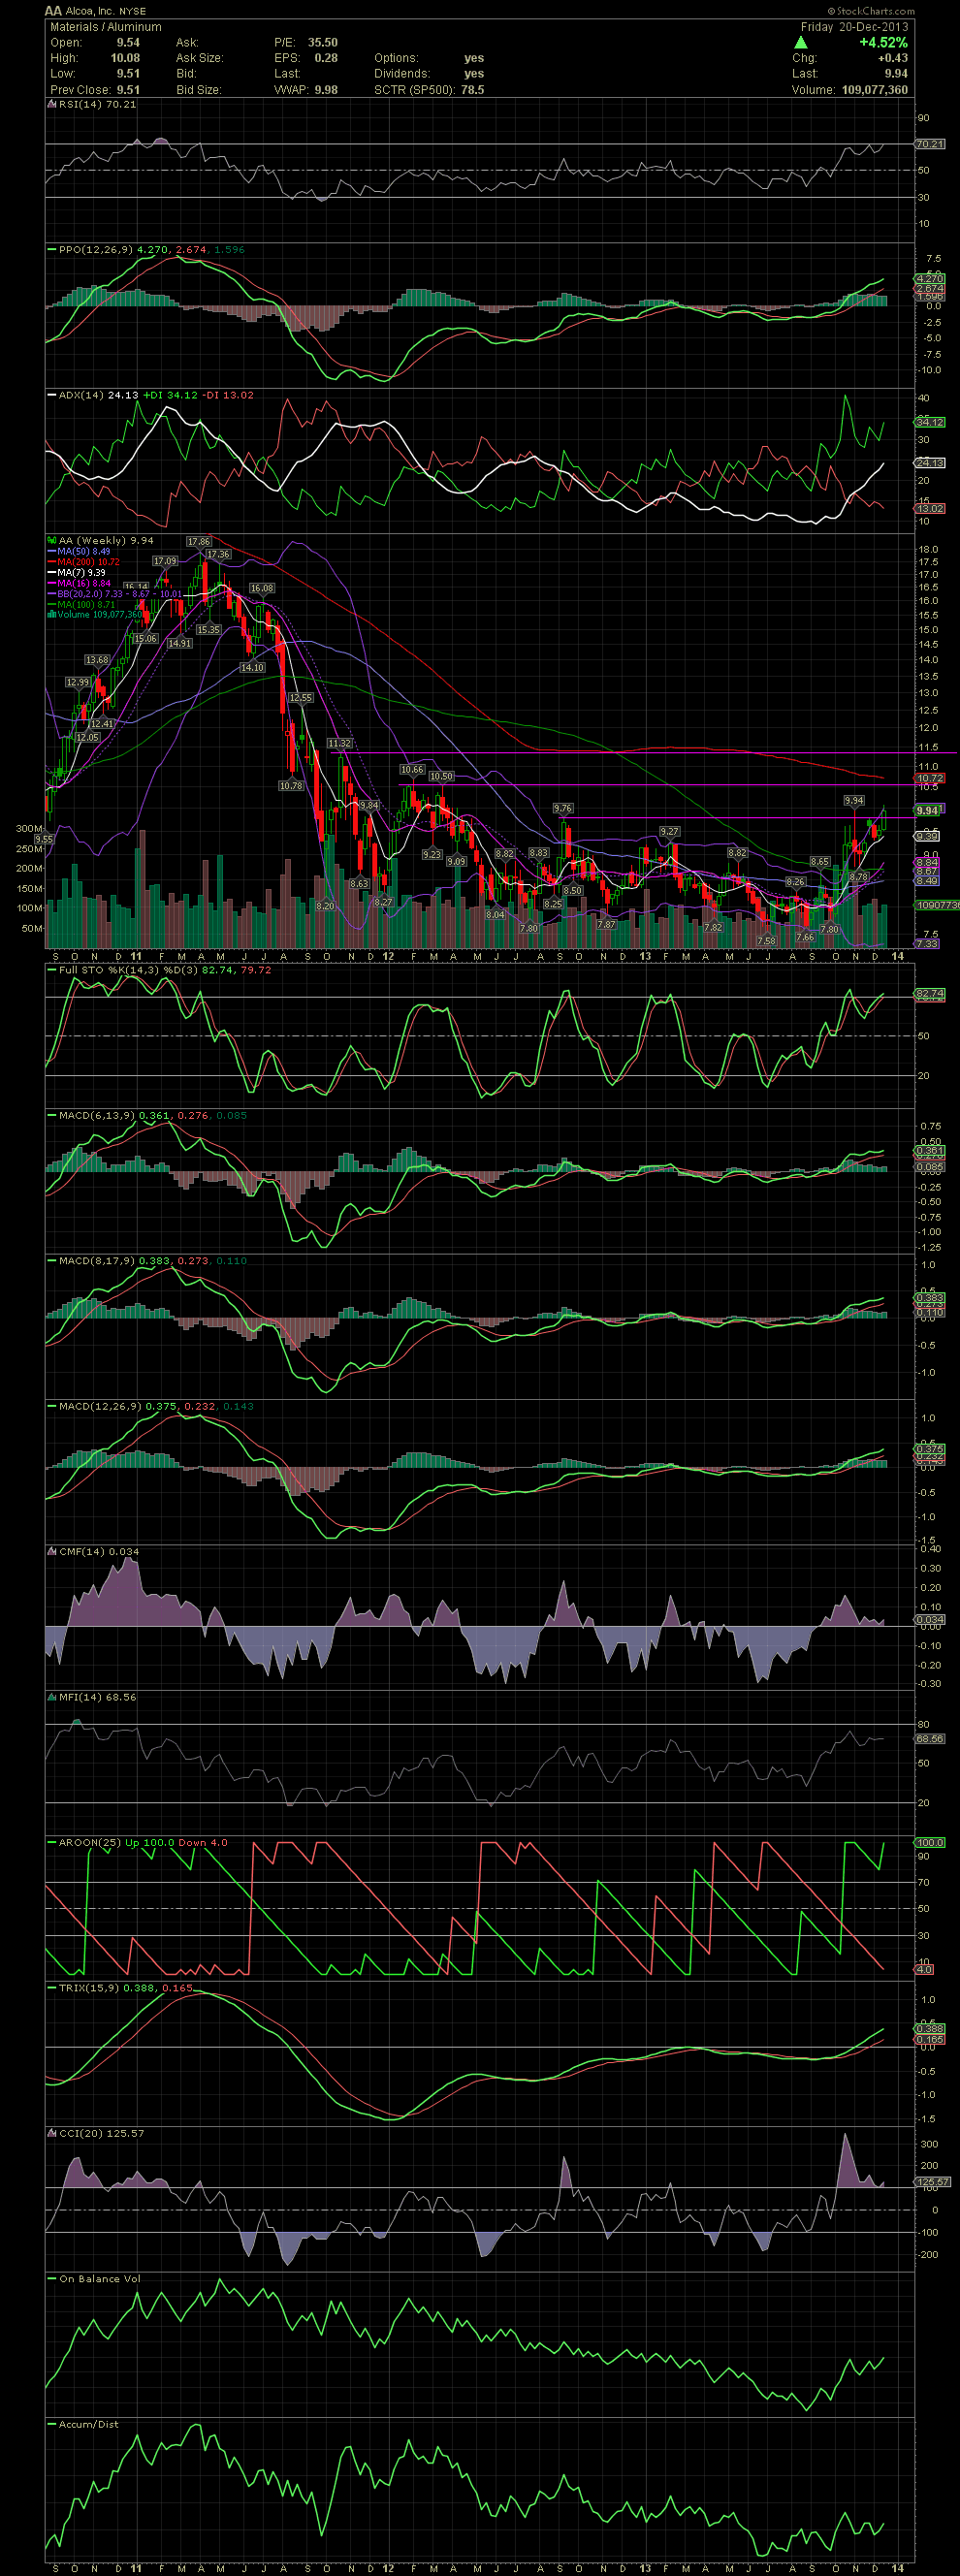
As the Daily Chart is showing a continued move, here is a look at the AA Weekly Chart. The first horizontal resistance target that I've marked on this chart a few weeks ago, has been seen this week. The next area of resistance would be the level of 10.50 and 10.66 followed by the MA200 at 10.72. As the global economy slowly continues to improve, AA could begin to recover to levels not seen in three years. GLTA
As the Daily Chart is showing a continued move, here is a look at the AA Weekly Chart. The first horizontal resistance target that I've marked on this chart a few weeks ago, has been seen this week. The next area of resistance would be the level of 10.50 and 10.66 followed by the MA200 at 10.72. As the global economy slowly continues to improve, AA could begin to recover to levels not seen in three years. GLTA