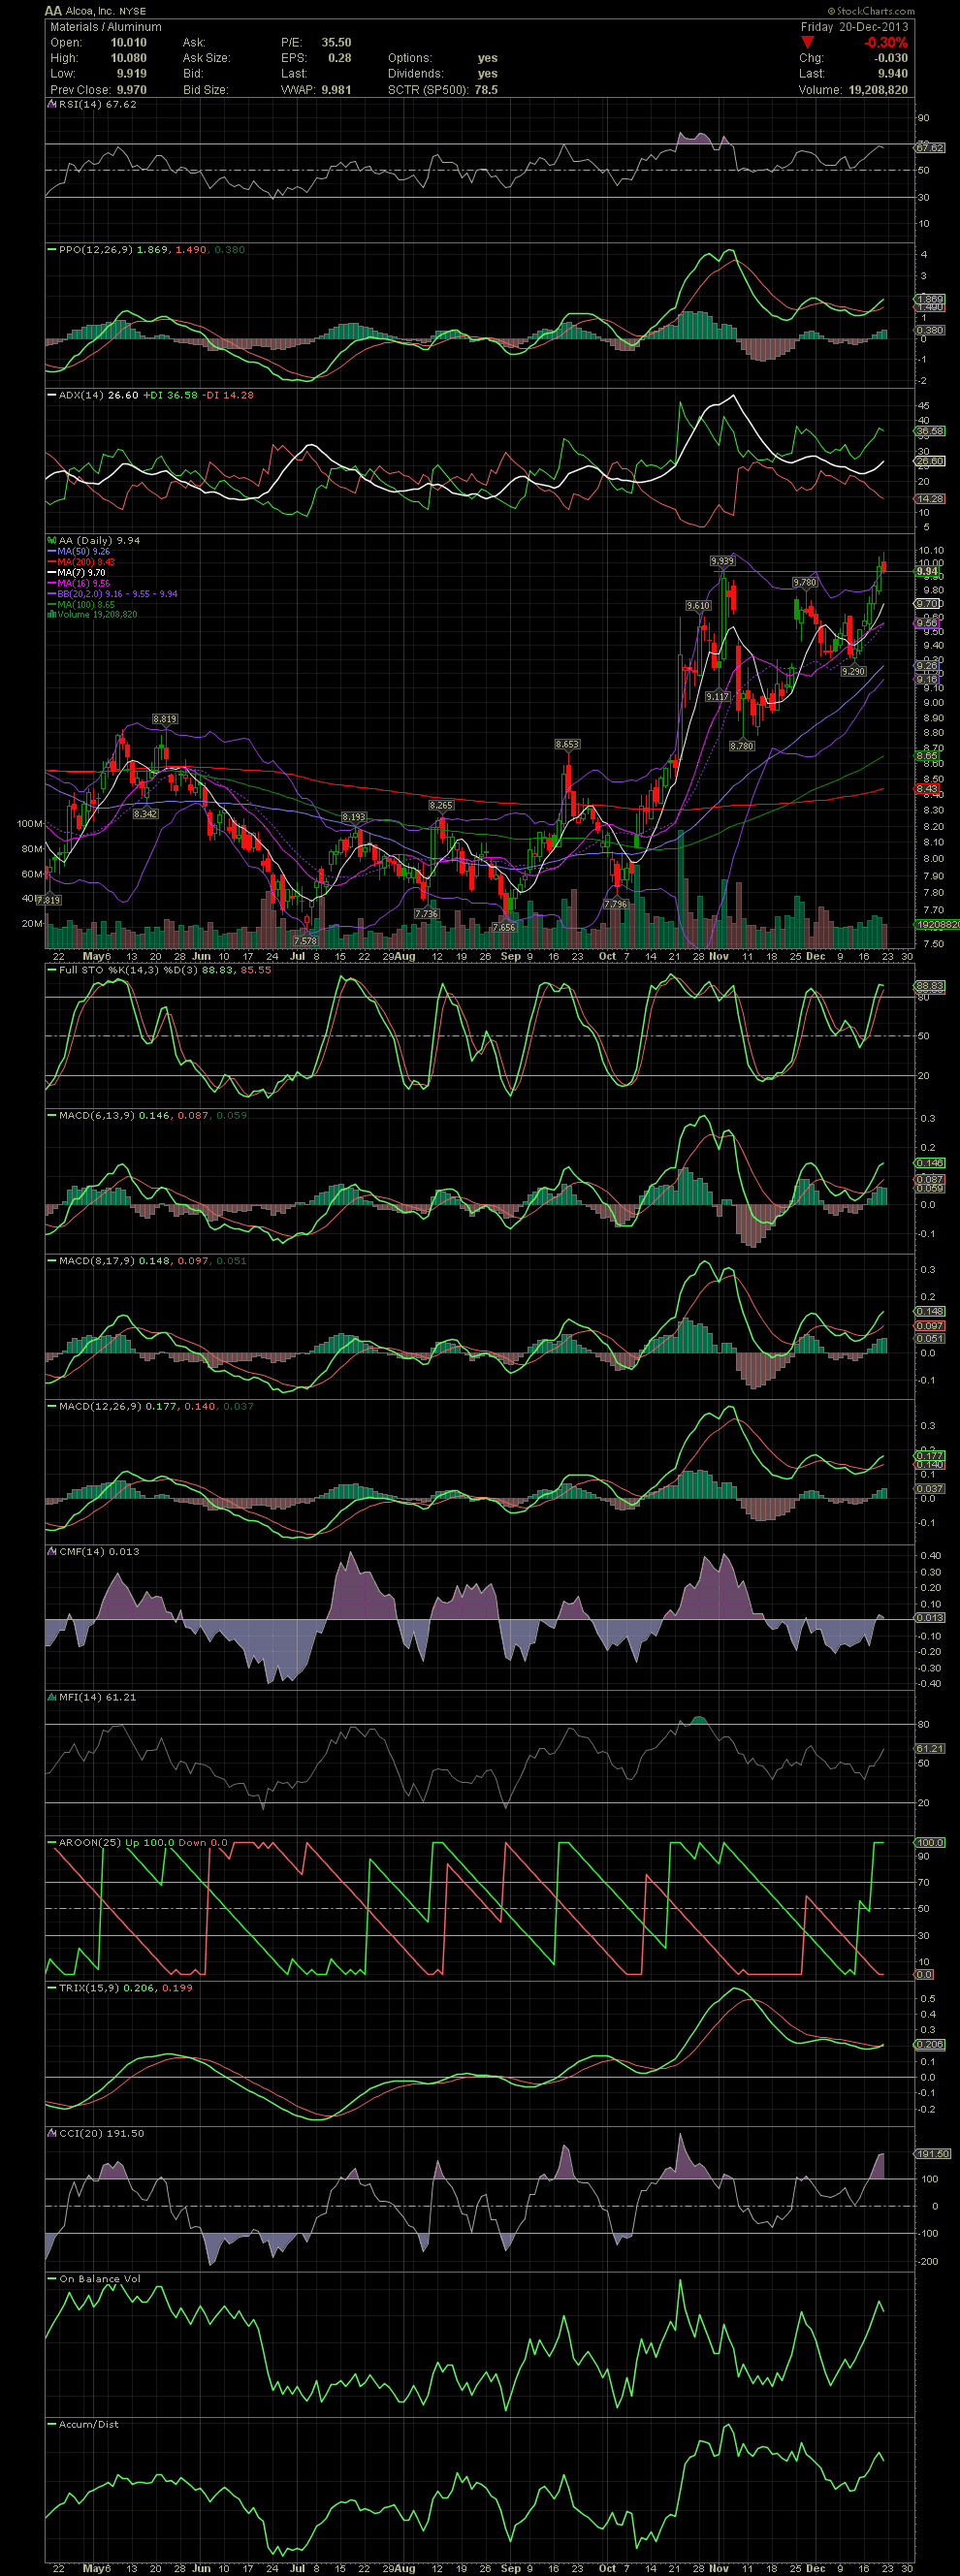
AA Daily Chart ~ Attempts to Break Above the $10.0
Post# of 2561

Our third swing trade in AA continued to deliver more gains last week. The stock, as you can see on the chart below, it now attempting to break into the $10.00+ range. The stock has closed above its previous high of 9.939 for the second day in a row. I'll post a Weekly Chart next so you can see the longer term potential of AA. GLTA

 (0)
(0) (0)
(0)