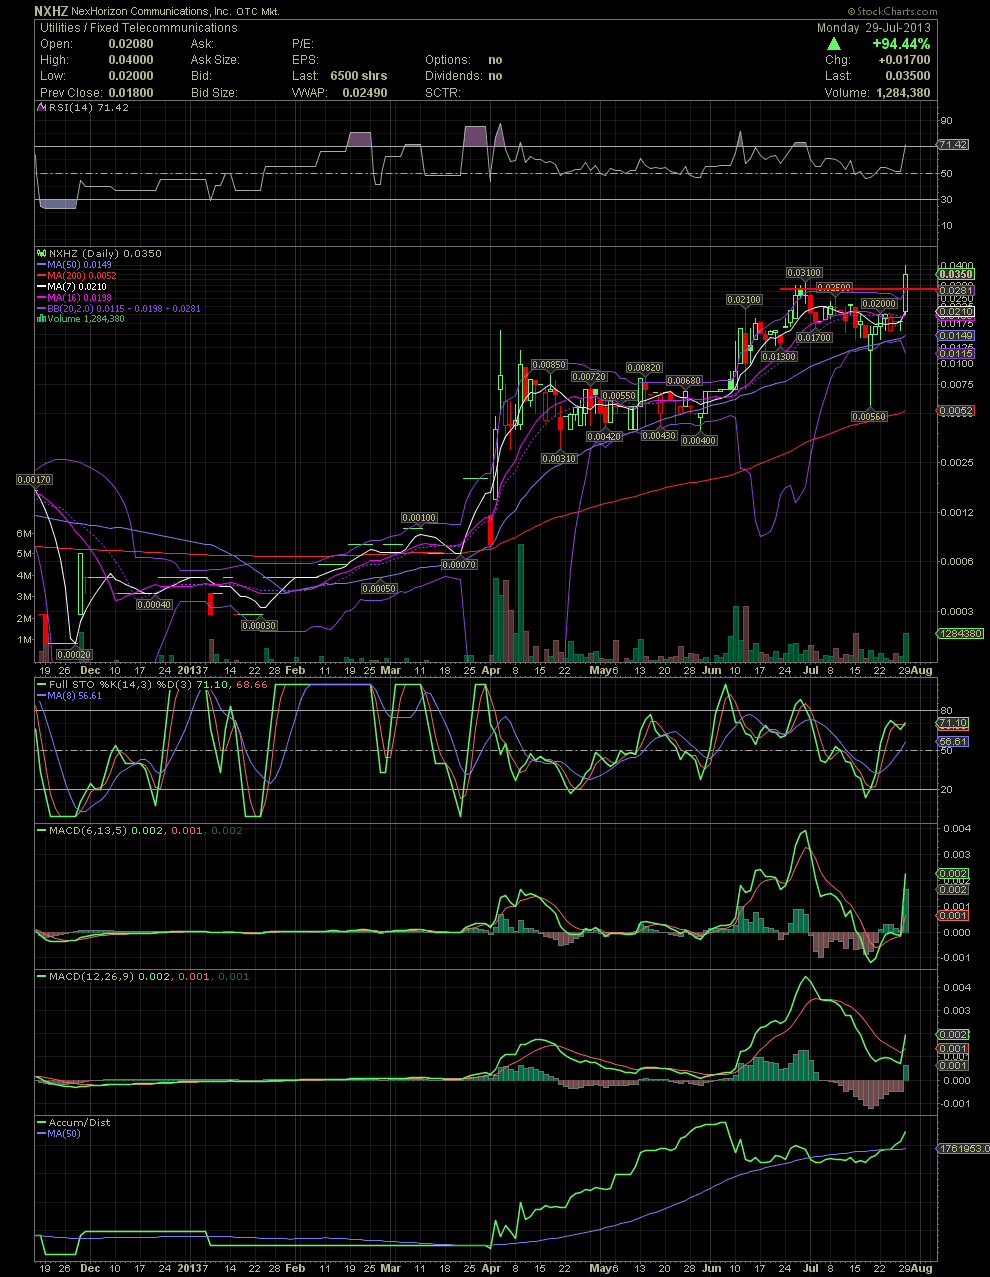
NXHZ Daily Chart....... Link Back to the NXHZ Chart of July 26
The beast is on the move. NXHZ and the uranium acquisition/merger is on our doorstep. The chart below tells the tale of a stock that has been growing from the .006s. Too bad there weren't all that many that were thrown out the window with the baby's bathwater back then. But yes, those of you that have been accumulating with me since the .01s, your accounts should be beginning to turn a nice shade of bright green with your investment in NXHZ.
Can you see the pattern since that began in early April? New high to the .01 level, consolidation, new high in June to the .02 level, consolidation, new high to the .03 level, consolidation, and today a new high to .04 today. All this as NXHZ continues toward its execution of its business plan and eventual uranium acquisition. The float of approx 43 mil makes for some volatility but also offers an opportunity of very cheap stock when someone decides to poop their pants as they did just under two weeks ago. If you believe in a company, one has to be ready to jump on those gifts that are thrown your way when foolish moves are made by others. NXHZ was sold off in approx 20 minutes from the .016s to .0056. I know a few of you who bought as low as .01 that day, and here we are tapping .04 today and closing at .035. Congratulations!!! Now look at the chart and observe what occurred today. Multi year high, a strong, green volume day, and a close over the previous high of .031. My guess is that NXHZ is now set for a move into the .10-.15 area by the end of August, maybe more. GLTA