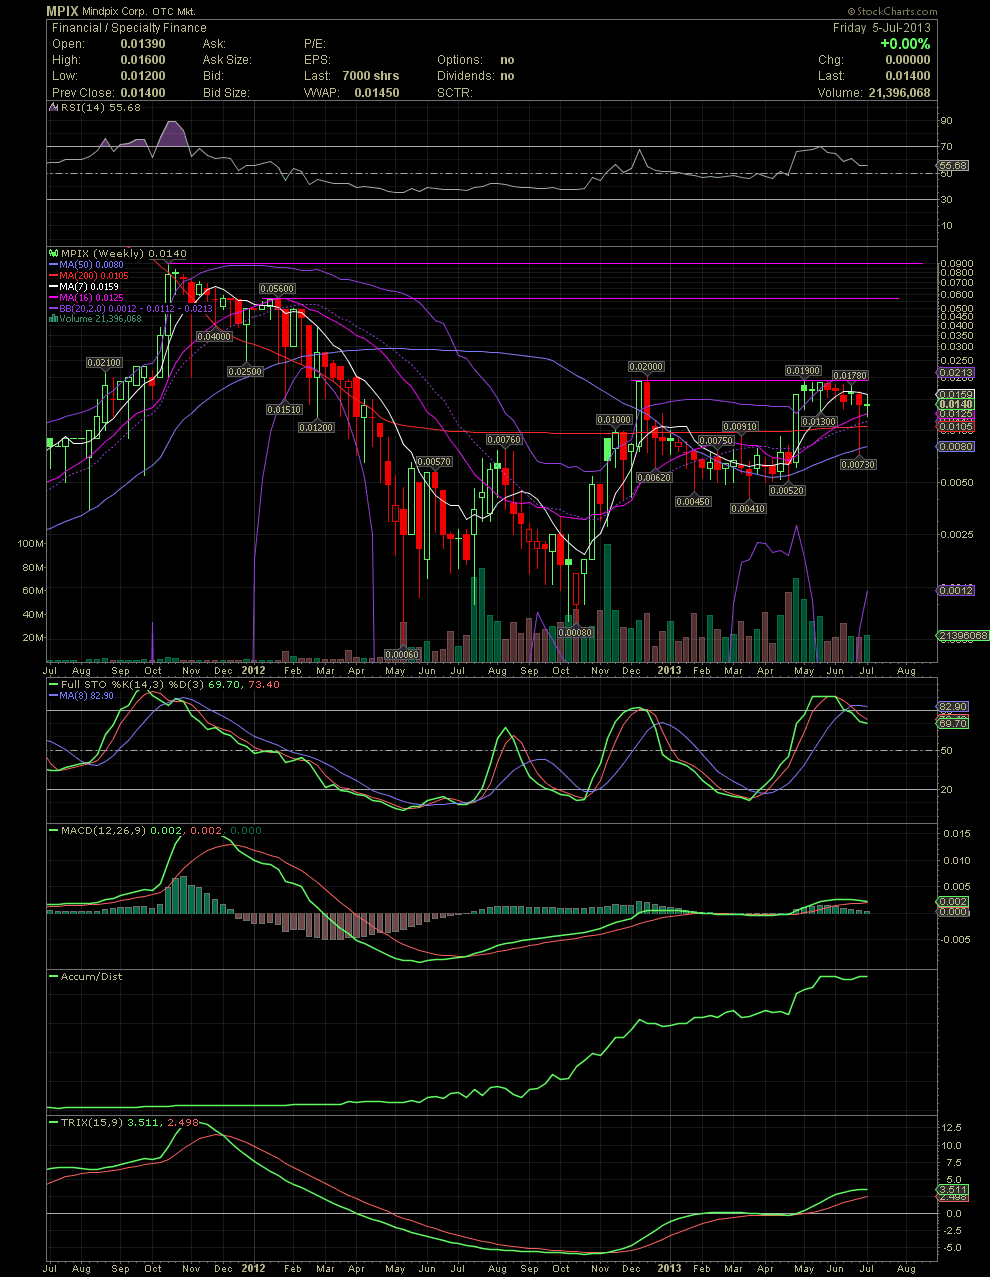
MPIX Weekly Chart ~ The Tale of the Coming Major Move Up
Many of you have already seen the Weekly Chart before. Where in the last two charts I've posted, each candle is one day. In the weekly chart below, each candle represents an entire week. My technical targets of .056 and 0885 are simply attained from previous highs or consolidation periods. I've drawn them in pink and you should consider those potential targets once the stock breaks above the red horizontal resistance line of .019/.02. One can see the massive volume increase once the stock finally bottomed out in May, 2012. I'm always asked where all the volume is coming from. Easy to answer if one follows what previous management did to the shareholders with their massive increases in OS. There is nothing wrong with dilution if management uses those funds to build a company. But since there is nothing to show for all that dilution, a logical conclusion was that ex-management did nothing but create stock and sell it. The new, world class management T.E.A.M. is doing the exact opposite. This is why the stock has moved from .0008 to as high as .02. Once the selling of the old 'leaders' has finally ended, along with everything we are anticipating from CEO Victor Siegel, COO Saul Federman, and COB Rick Garson, the share price will reflect all the positive changes. GLTA

