Investors Hangout Stock Message Boards Logo
  • Home
  • Mailbox
  • Boards
  • Favorites
  • Whats Hot!
  • Login - Join Now!
Mindpix Corporation MPIX
Posted On: 07/07/2013 2:59:07 PM
Post# of 5570
Avatar
Posted By: Big Tuna

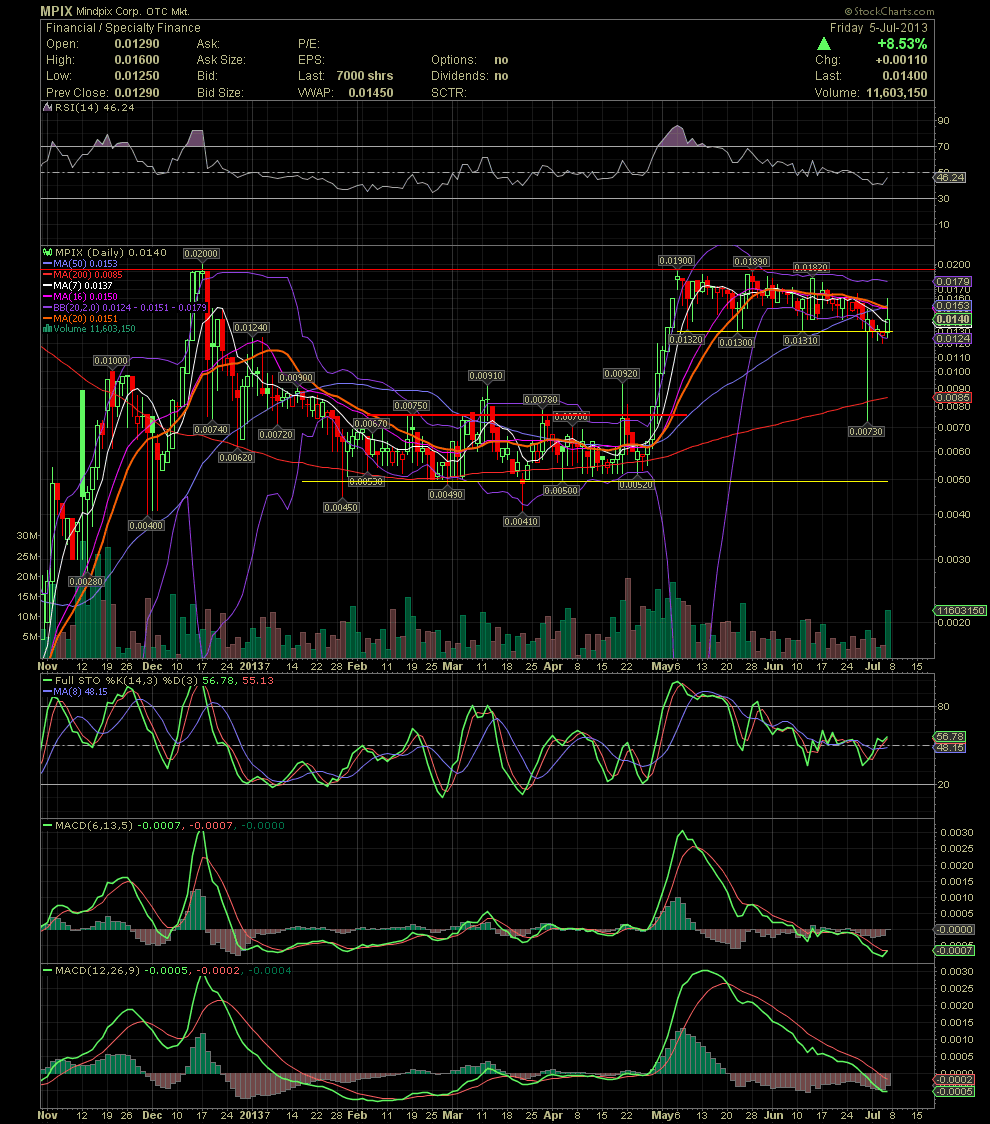
MPIX Daily Chart ~ Channeling for Weeks


I thought I would share a look at the channeling that MPIX has been doing which was the same the stock did back in Feb to late April when a lot of impatient, nervous and short mined traders sold in the .005-.007 range. Please note the similarities of both channels, yellow line being the support and red being the resistance. Follow the movements of the stock and the corresponding setups of the FullSto and MACDs just prior to the breakout of early May. Also, note the result when the stock finally broke out above the red resistance top of the lower channel. There are always clues with technicals including the sell signals. When MPIX finally breaks out over the .019/.02 level, look out above. The move can be swift and aggressive. Check out the weekly chart for my reasoning on this technical opinion. GLTA


(0)
(0)


  • New Post - Investors HangoutNew Post

  • Public Reply - Investors HangoutPublic Reply

  • Private Reply - Investors HangoutPrivate Reply

  • Board - Investors HangoutBoard

  • More - Investors HangoutMore

  • Keep Post - Investors HangoutKeep Post
  • Report Post - Investors HangoutReport Post
  • Home - Investors HangoutHome
  • Mailbox - Investors HangoutMailbox
  • Boards - Investors HangoutBoards
  • Favorites - Investors HangoutFavorites
  • Whats Hot! - Investors HangoutWhats Hot!
  • Settings - Investors HangoutSettings
  • Login - Investors HangoutLogin
  • Live Site - Investors HangoutLive Site