Posted On: 03/10/2013 1:19:47 PM
Post# of 2561

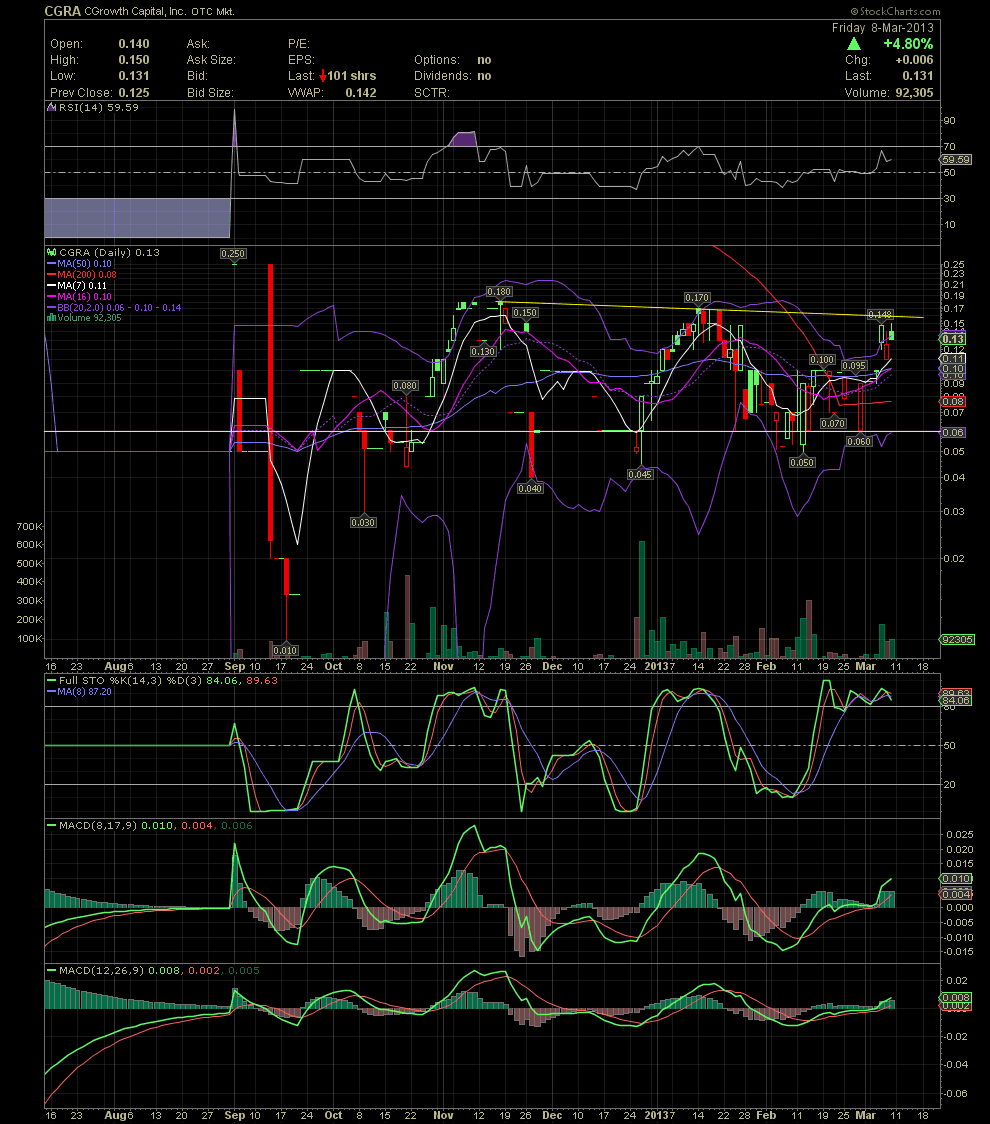
CGRA Daily Chart........ Nearing the Upper Resistance Line
A few of us have been accumulating and holding CGRA since the lows of .04-.06 while averaging up into the .09s. For those that might have been trading the stock between the yellow channel lines, you've done well. Entering a stock near support levels is a calculated risk but with much lower risk than buying near a resistance point. Will the stock breakout thru the upper resistance or fail? That's the question, lol. I like the MACDs and the RSI but not the FullSto. But should that event occur this week, I see the mid .20s as a very possible move. The stock is very thinly traded so with any strong momentum, and the .30s are quite possible. GLTA