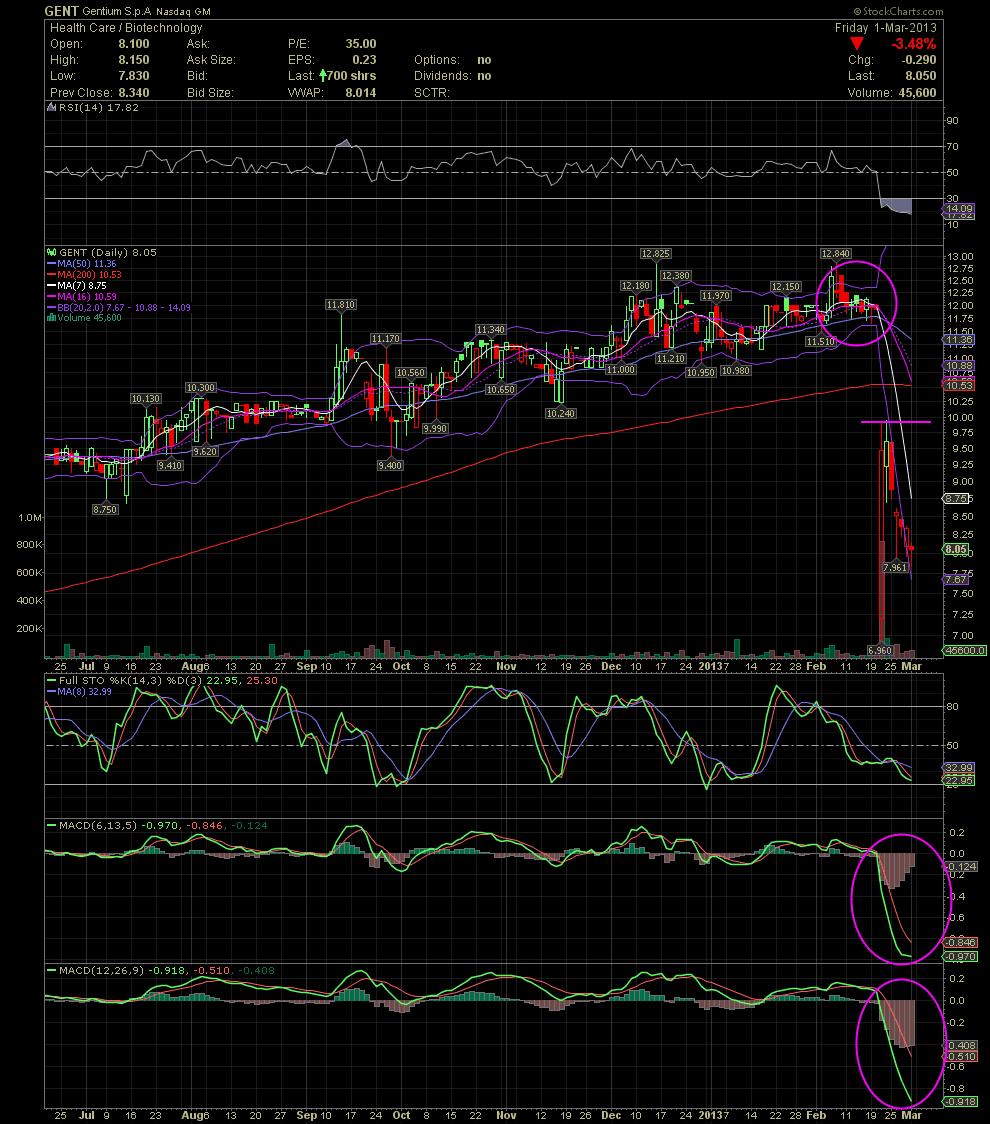
GENT Daily Chart...... The Pain Continues for Those That Didn't Listen to the Sell Signals
This will probably be my last chart on GENT for a while, but two of you asked me for a current chart and thoughts. So here are my opinions. Link back to my post of Feb 21. As I mentioned to a few of you in PM and email on the day of collapse, if the stock rallied back to the intraday high of that day and didn't break above it, then you should stick a fork in it. The price of that high was 9.90 to 9.94. It's obvious what occurred since then. While a few thought they were bottom fishing, take a look at the MACDs. The shorter term MACD is trying to bottom out. The FastSto and slower MACD aren't there yet. This one is waiting for a major capitulation selloff. Just my opinion but I'm staying clear for now.