Posted On: 03/03/2013 12:47:53 PM
Post# of 2561

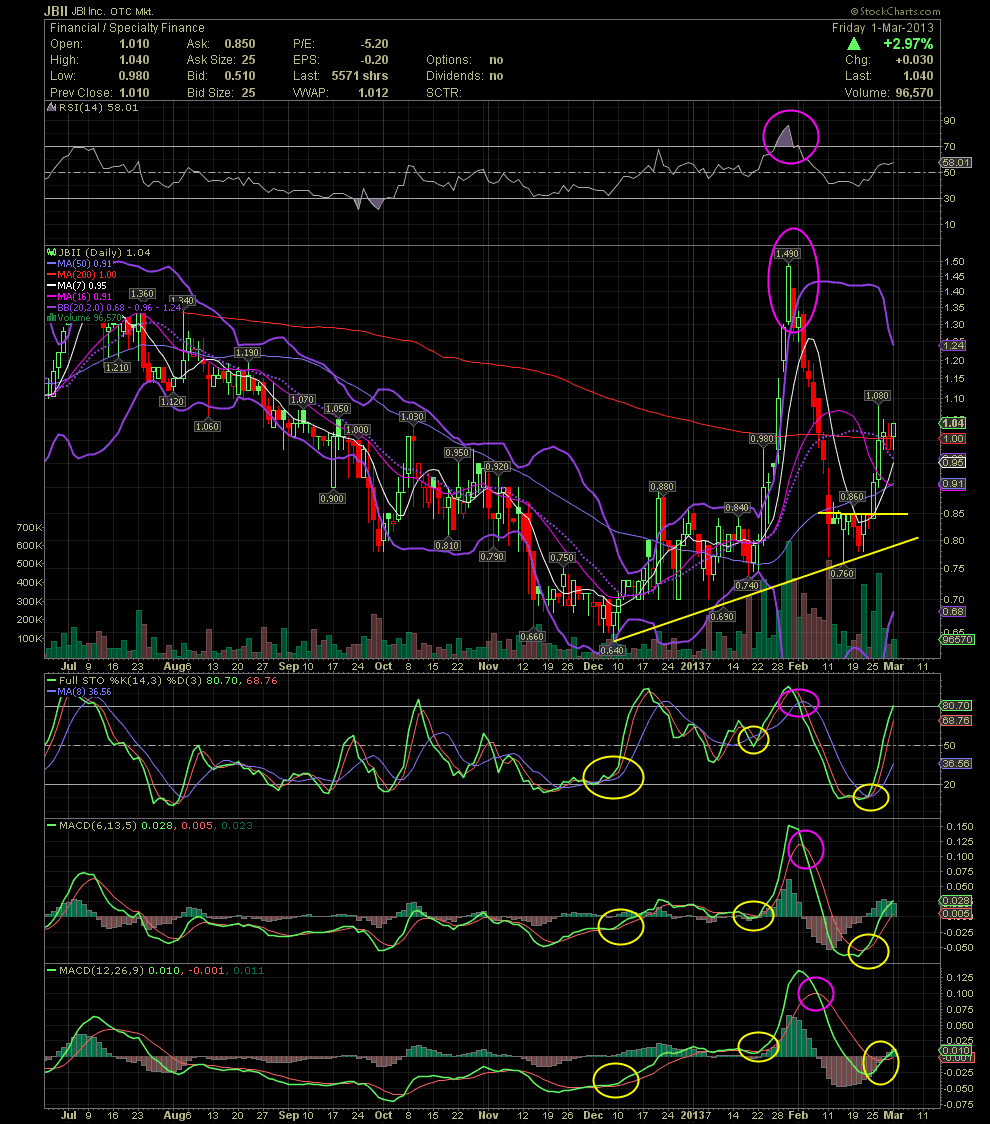
JBII Daily Chart......... Link Back to Feb 23 for My Previous Comments
I mentioned to keep an eye on any break above the .85 tops for a possible breakout to the upside. A break thru the .85 did occur the very next day and resulted in a quick pop to 1.08 or 27% in three days. As I've mentioned many times in the past, JBII is one great stock to swing trade. Just follow the indicators. I circled quick a few of them on my Feb 23 post, and the result was profitable to those of you that executed on them. GLTA