(Total Views: 669)
Posted On: 07/17/2020 7:30:25 AM
Post# of 157303

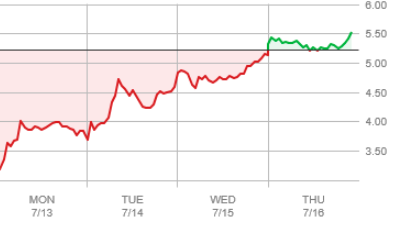
RSI was mentioned for the day we hit $10, it was a staggering 95. Today we are at 55.
Relative Strength Index (RSI)
The RSI oscillates between zero and 100. Traditionally the RSI is considered overbought when above 70 and oversold when below 30. Signals can be generated by looking for divergences and failure swings. RSI can also be used to identify the general trend.

Relative Strength Index (RSI)
The RSI oscillates between zero and 100. Traditionally the RSI is considered overbought when above 70 and oversold when below 30. Signals can be generated by looking for divergences and failure swings. RSI can also be used to identify the general trend.

