(Total Views: 491)
Posted On: 04/21/2017 1:23:07 AM
Post# of 3935
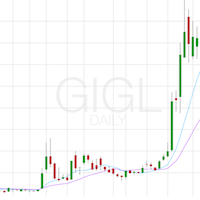
Hey this is LukeTrader with your report for ticker symbol $GIGL. Let's take a look at the 30 minute time frame. Real quick, what do I mean by 30 minutes? Well incase your a complete idiot and don't know that 30 minutes is half an hour or 1800 seconds that's exactly what it means. Yes, thirty of those sixty second minutes is represented by these candlesticks. Now when we're looking at this chart with my Wisconsin accent let me just say I'm an expert at not having a clue what I'm talking about. So if the price is going up that means the "bulls" are in control. And if the price is going down it means the "bears" are in control. Now if you were to ask me my opinion and say " hey Luke, what would make this chart look absolutely the best here?! Well I'd say if the share price can stay high and keep going higher than that's really bullish. That means the "bulls are in full control". Now if the price can't stay above this purple line I draw here than all you noobs who don't have a clue what you're doing so you actually watch my videos completely devoid of information should probably sell. Now if you guys don't sell at this first line the I'll draw another one down here that if it gets to that point well than I'd say you should definitely sell down here because trading has nothing to do with investing. And investing has nothing to do with the future and projected growth or expansion. Now you might be wondering how do I find these stocks that I supposedly trade when in fact I never say if I'm buying or selling and so no one knows if I trade at all. But doesn't that make you want to buy my book?!

