(Total Views: 1523)
Posted On: 02/26/2017 5:24:25 PM
Post# of 2561

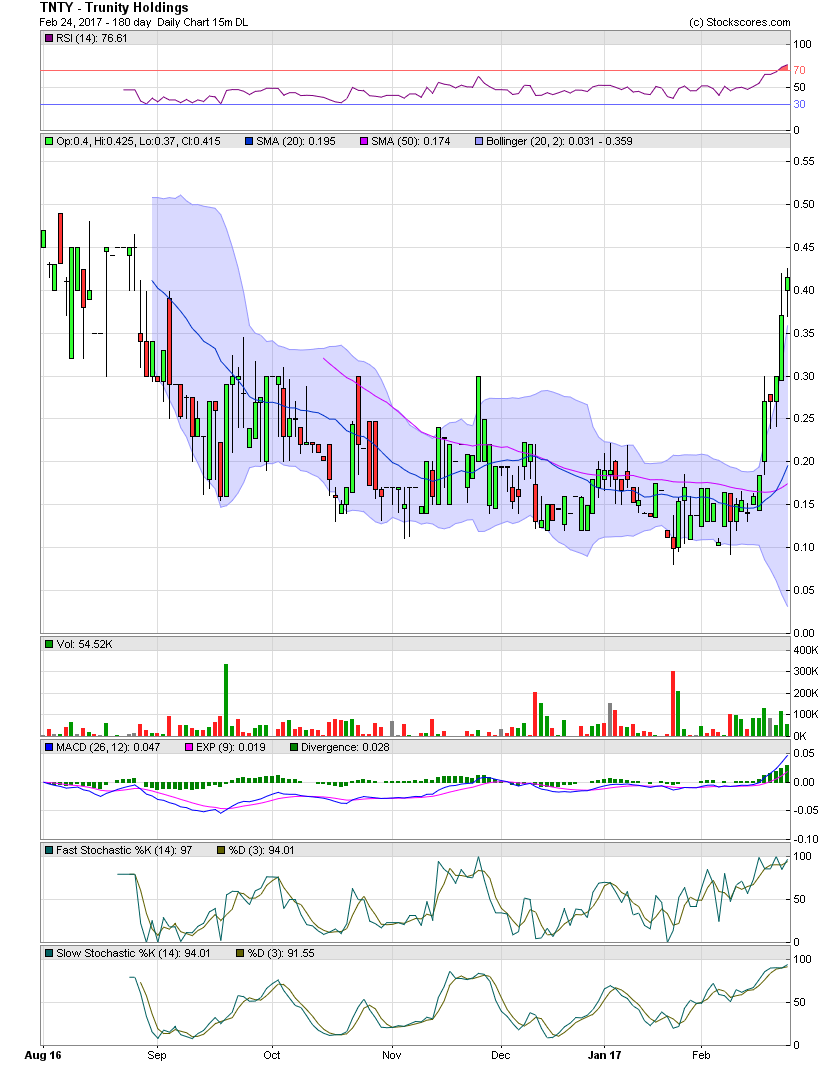
TNTY Daily Chart ~ Another Nice Move Higher Last Week
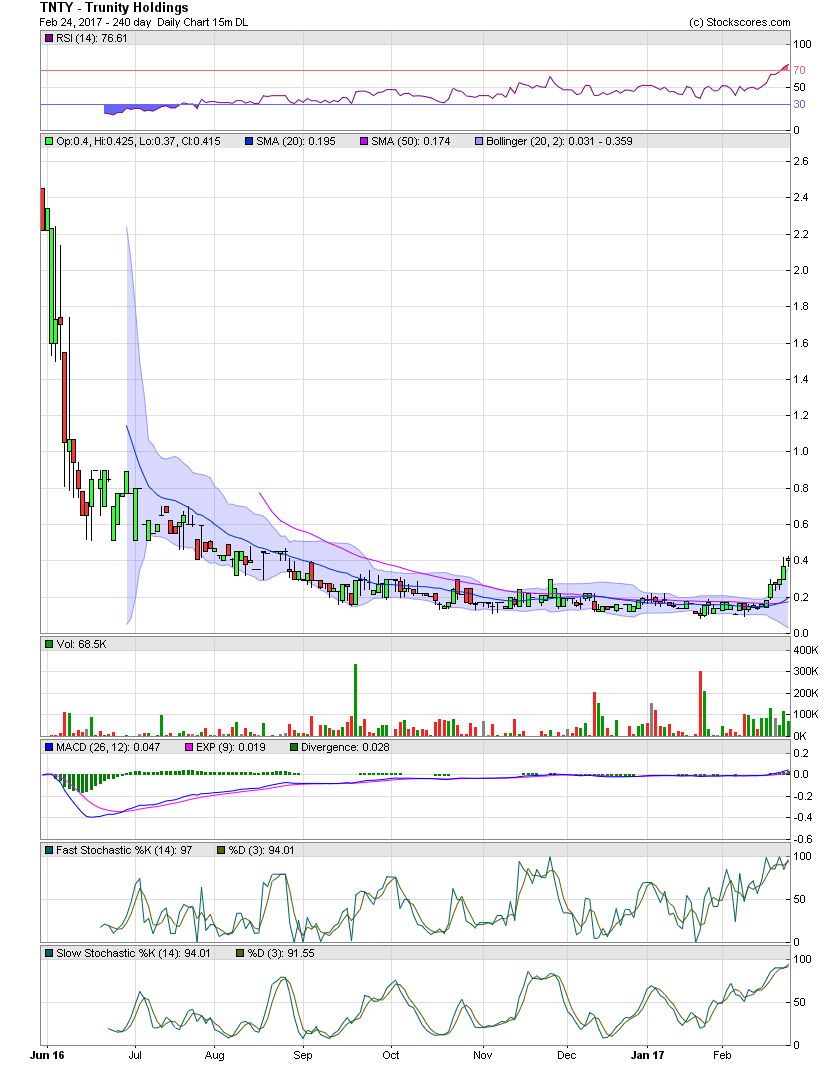
TNTY executed another solid week. So far, the stock has moved from the .09s just two weeks ago to finish at .415 on Friday. I'm sharing another two charts below. The first TNTY Chart is a shorter term view while the second it a look at the big picture and where the stock might return someday as management continues to execute.
The stock price moved quickly over the multi-month, triple top that has been in place at .30 since September. Although overbought on a technical basis, rumors of fundamental news, along with sustained accumulation, I'm hoping for much more on the upside. The second chart shows where the stock fell from due to a failed acquisition which was primarily the reason for the decline. I would expect the next level of horizontal resistance to occur at the .50 level and followed by a move to the mid .70s. Longer term, as management executes, I see no reason why the stock price can't return to the previous highs in the multiple dollars, seen over $3.00 in May 2016. All it takes is contracts, revenues and profits. GLTA